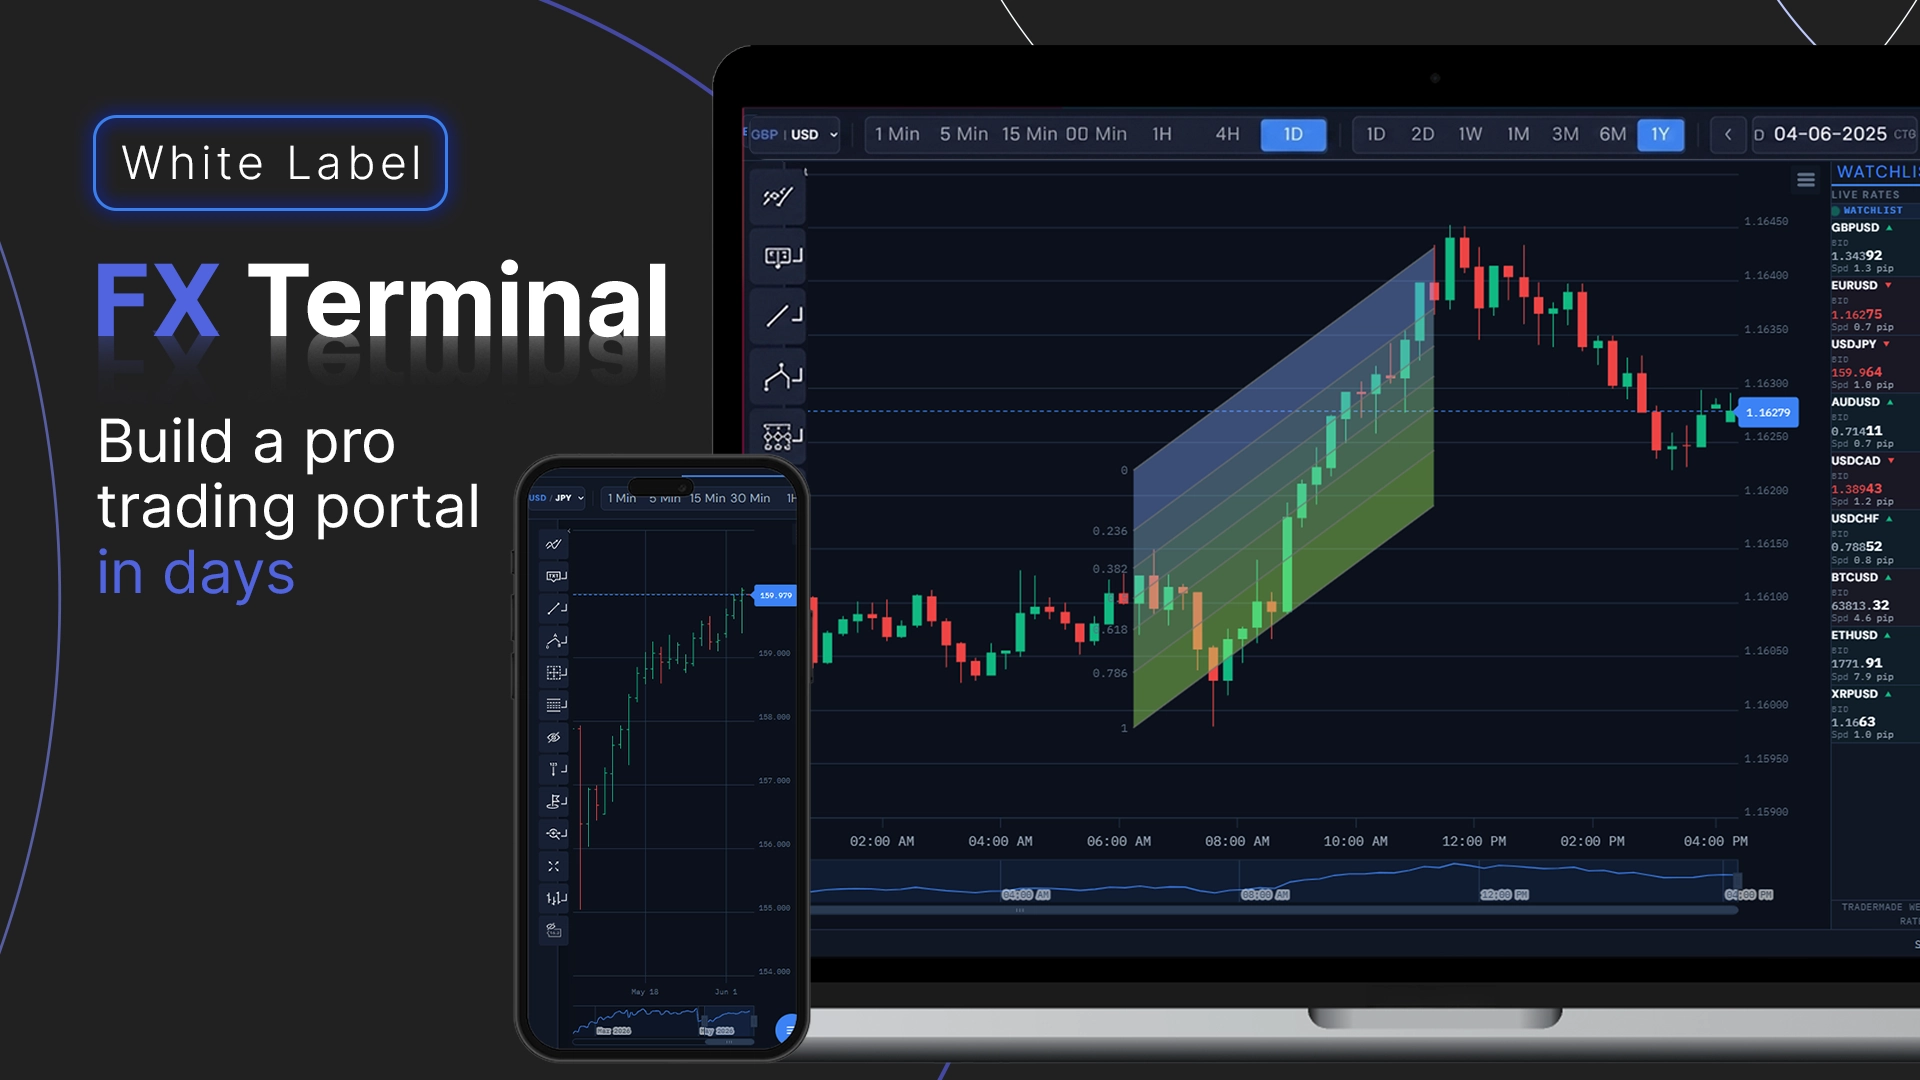
If you want full control over your market-data UI, this tutorial shows you how to build and deploy a professional, production-ready trading terminal on your own infrastructure.
The application is a high-performance, multi-asset React trading dashboard powered by TraderMade's enterprise REST and WebSocket APIs. It includes live streaming rates, candlestick charts, real-time tick updates, technical indicators, drawing tools, an integrated watchlist, market news, light/dark themes, and a secure backend proxy to keep your critical API credentials safe.
We will start by launching the project locally on localhost, then package the entire system for a production-ready environment.
What You Will Build
By the end of this tutorial, you will have a fully functional, multi-asset financial terminal featuring:
- Multi-Asset Coverage: Live quotes and historical feeds for global FX pairs, metals, energies, equity indices, major stocks, and cryptocurrencies.
- Professional Charting: Candlestick, OHLC, and line charts powered by the robust Highcharts Stock library.
- Dual-Channel Data Flow: TraderMade REST endpoints for historical candle data paired with TraderMade WebSockets for live, real-time tick delivery.
- Advanced UI Elements: Interactive asset watchlists, live rates tables, and a custom date picker featuring both Date and Custom Range modes.
- Persistent Customization: Technical indicators (SMA, RSI, MACD, etc.) and visual theme choices that persist across symbols, alongside per-symbol saved chart annotations.
- Secure API Architecture: A backend proxy server that manages all upstream data traffic, ensuring your proprietary TraderMade API keys never reach the client-side browser.
Prerequisites
You need:
- Node.js 20 or newer
- npm
- Git
- A TraderMade REST API key
- A TraderMade WebSocket API key
You can create an account at tradermade.com/signup.
TraderMade uses two data channels in this project:
- REST API key: historical and timeseries candles
- WebSocket API key: live streaming bid/ask ticks
The browser never receives these keys. They are read by server.js from your .env file.
⚠️ Commercial License Note: The charting interface in this project is powered by Highcharts Stock. Highcharts is free for personal, non-commercial testing, but requires a commercial license for production business applications, fintech startups, and institutional trading desks.
1. Clone and Install
The complete source code for this multi-asset dashboard is open-source and hosted on GitHub. Clone the project directly from the TraderMade Trading Terminal Repository:
git clone https://github.com/tradermade/fullstack-market-data-terminal-react
cd fullstack-market-data-terminal-react
Install dependencies:
npm install
The project uses React, Vite, Express, Highcharts Stock, and the ws WebSocket library.
2. Project Structure
Here is the main layout:
tradermade-charting-portal/
+-- public/                # Highcharts modules, UI icons, and assets
+-- src/
|   +-- components/        # Chart, toolbar, settings, watchlist, news
|   +-- constants/         # Symbols, markets, timeframes, theme defaults
|   +-- context/           # Shared browser WebSocket context
|   +-- hooks/             # Reusable React hooks
|   +-- pages/             # Live Rates page
|   +-- styles/            # Global CSS variables
+-- data/                  # Generated runtime state, not required up front
+-- dist/                  # Generated by npm run build
+-- .env                   # Your API keys, not committed
+-- .env.example           # Example environment variables
+-- Dockerfile
+-- docker-compose.yml
+-- server.js              # Express server, REST proxy, WebSocket proxy
+-- vite.config.js
+-- package.json
server.js is the only backend entry point. It serves the built React app, proxies REST requests to TraderMade, opens one shared upstream TraderMade WebSocket connection, and forwards ticks to connected browser clients.
There is no external database to install. The server may create data/active-symbols.json to remember the last active WebSocket subscription set, but chart preferences are stored in the browser using localStorage or sessionStorage.
3. Configure API Keys
Create a .env file in the project root.
On macOS or Linux:
touch .env
On Windows PowerShell:
New-Item -Path . -Name ".env" -ItemType File
Add your keys:
TRADERMADE_API_KEY=your_rest_api_key_here
TRADERMADE_WS_API_KEY=your_websocket_api_key_here
Optional settings:
# Use a custom logo in the top-left navbar
VITE_LOGO_URL=https://your-domain.com/logo.png

# Optional browser-side WebSocket proxy override
# Used when the frontend and backend run on different hosts
VITE_PROXY_WS_URL=ws://localhost:3001

# Optional server port
PORT=3001
Do not commit .env. It is already ignored by .gitignore.
4. Build and Run Locally
Build the frontend:
npm run build
Start the Node server:
node server.js
You should see logs similar to:
Server started: 2026-06-05T14:30:00.000Z
WS API Key found, starting proxy...
REST API Key found, adding proxy routes...
WebSocket proxy + Frontend running on port 3001
Open:
http://localhost:3001
The app opens on the Live Rates page. Click a symbol row to open the chart page, or go directly to:
http://localhost:3001/forex-charts
5. How the Data Flow Works
To understand why this architecture is production-ready, it helps to see how data is routed. The client browser never interacts with the data provider directly:
┌────────────────────┐          ┌──────────────────────┐          ┌────────────────┐
│  TraderMade Core   │  REST    │    Node.js Server    │  WebSkt  │  React Client  │
│  Enterprise APIs   ├─────────►│  (Secure Sync Proxy) ├─────────►│  (Dashboard)   │
│ (Historical/Ticks) │  WebSkt  │  [API Keys Isolated] │  Local   │  [Highcharts]  │
└────────────────────┘          └──────────────────────┘          └────────────────┘
Core Architecture Under the Hood While the repository handles the visual layout out of the box, understanding how the components process data streams is essential for extending the platform.
- Managing Downstream Tick Broadcasts In server.js, a single persistent connection to TraderMade is maintained. Instead of spinning up upstream connections for every browser instance, incoming ticks are parsed, normalized, and distributed locally to active room rooms:
// server.js - Upstream WebSocket listener & local broadcaster
tradermadeWs.on('message', (data) => {
    const tick = JSON.parse(data);
    const normalizedTick = {
        symbol: tick.symbol,
        bid: tick.bid,
        ask: tick.ask,
        mid: (tick.bid + tick.ask) / 2,
        timestamp: Date.now()
    };

    // Broadcast cleanly to all browser clients subscribed to this symbol
    broadcastToRoom(tick.symbol, normalizedTick);
});
- Consuming Real-Time Ticks into Highcharts Series On the client side, components tap into a centralized WebSocket context hook to update currently forming candles natively without re-triggering full chart renders:
// src/hooks/useChartStream.js
useEffect(() => {
    if (!socket || !activeSymbol) return;

    const handleTick = (event) => {
        const tick = JSON.parse(event.data);
        if (tick.symbol !== activeSymbol) return;

        const chart = chartRef.current?.chart;
        if (chart) {
            const series = chart.series[0];
            const lastPoint = series.data[series.data.length - 1];

            // Check if tick belongs to the current candle time block or starts a new one
            if (tick.timestamp < lastPoint.x + timeframeMs) {
                lastPoint.update({
                    close: tick.mid,
                    high: Math.max(lastPoint.high, tick.mid),
                    low: Math.min(lastPoint.low, tick.mid)
                }, true, false);
            }
        }
    };

    socket.addEventListener('message', handleTick);
    return () => socket.removeEventListener('message', handleTick);
}, [socket, activeSymbol]);
The browser never connects directly to TraderMade. It connects to your own Node server. The Node server logs in to TraderMade using TRADERMADE_WS_API_KEY, subscribes to symbols, receives ticks, normalizes them, and forwards them to any browser client that requested those symbols. This architecture secures your critical financial application keys by keeping them entirely server-side.
Historical Candles
When you open a chart or change timeframe/range, the browser calls:
/api/timeseries?currency=EURUSD&start_date=...&end_date=...&interval=minute&period=5&format=records
The Node server forwards that request to TraderMade's timeseries API and returns normalized OHLC rows.
TraderMade has request-window limits for intraday data. The proxy handles this by:
- Clamping future
end_datevalues syncing with TraderMade's server clock to avoid timestamp synchronization errors - Splitting longer requests into smaller chunks where allowed
- Deduplicating candle rows after chunking
The browser then stores successful chart requests in sessionStorage, so switching back to the same symbol/timeframe/range during the same browser session is fast.
Checkout Rest Api docs for detailed documentation.
Live Chart Ticks
Historical candles come from REST, but the currently forming candle is updated by WebSocket ticks.
For example:
- You open GBP/USD on the 1-minute timeframe.
- REST returns closed historical 1-minute candles.
- The WebSocket sends live GBP/USD bid/ask ticks.
- The browser buckets each tick into the active 1-minute candle.
- The candle's high, low, and close update in real time.
- When the next minute begins, a new candle is appended without resetting your zoom.
The chart also polls the last two REST periods in the background as a safety net, so missed ticks are reconciled.
Checkout Websocket Api docs for detailed documentation.
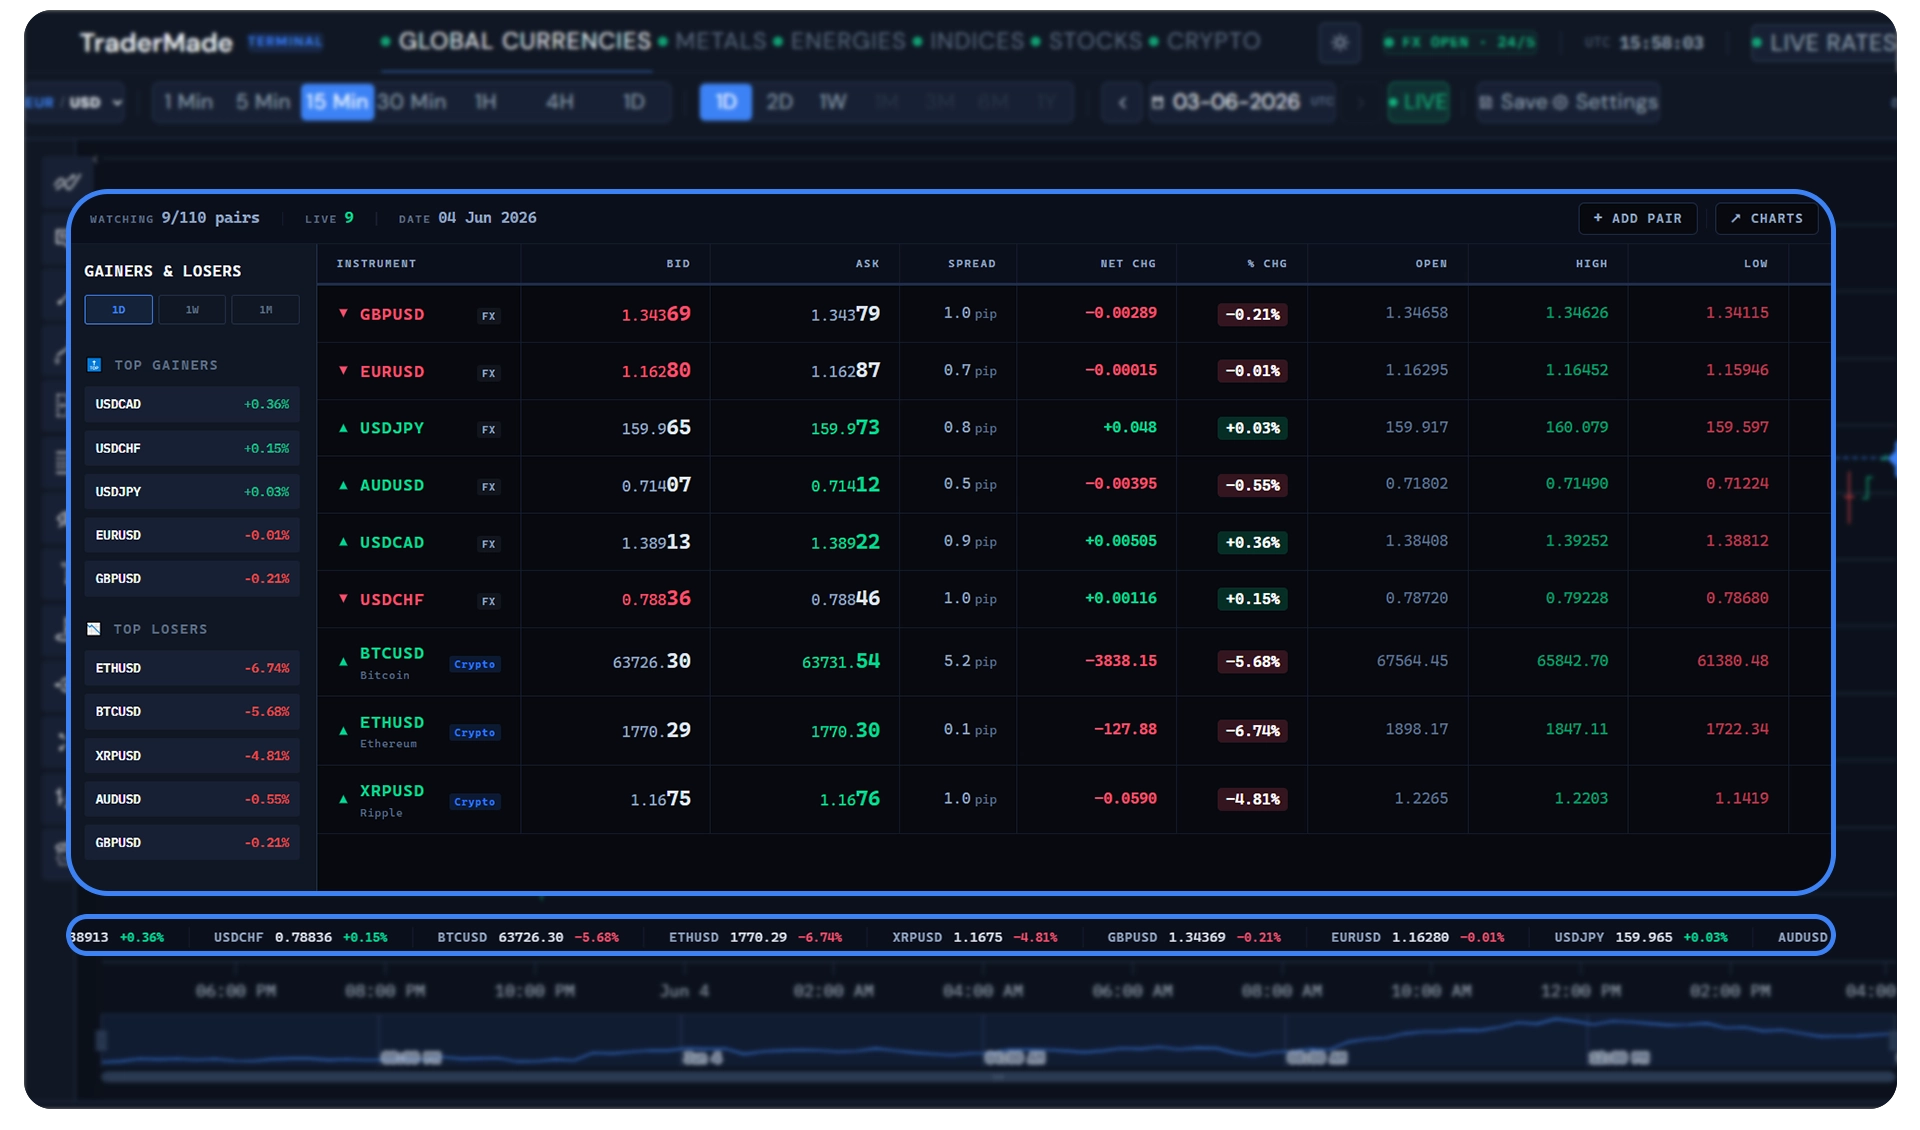
Live Rates
The Live Rates page is mostly WebSocket driven. It receives live bid/ask ticks, tracks spread, open, high, low, net change, and percentage change, and shows top gainers/losers over 1D, 1W, and 1M windows.
For less active symbols, the server asks TraderMade for send_last data and also uses a REST live snapshot fallback so the UI is not stuck on empty dashes while waiting for the next live tick.
6. Use the Terminal
Market Navigation
The top navigation switches between:
- Global Currencies
- Metals
- Energies
- Indices
- Stocks
- Crypto
Each market has its own symbol list and market-status label. Crypto is treated as 24/7. FX and CFDs respect weekend closures, and stocks follow the US market session.
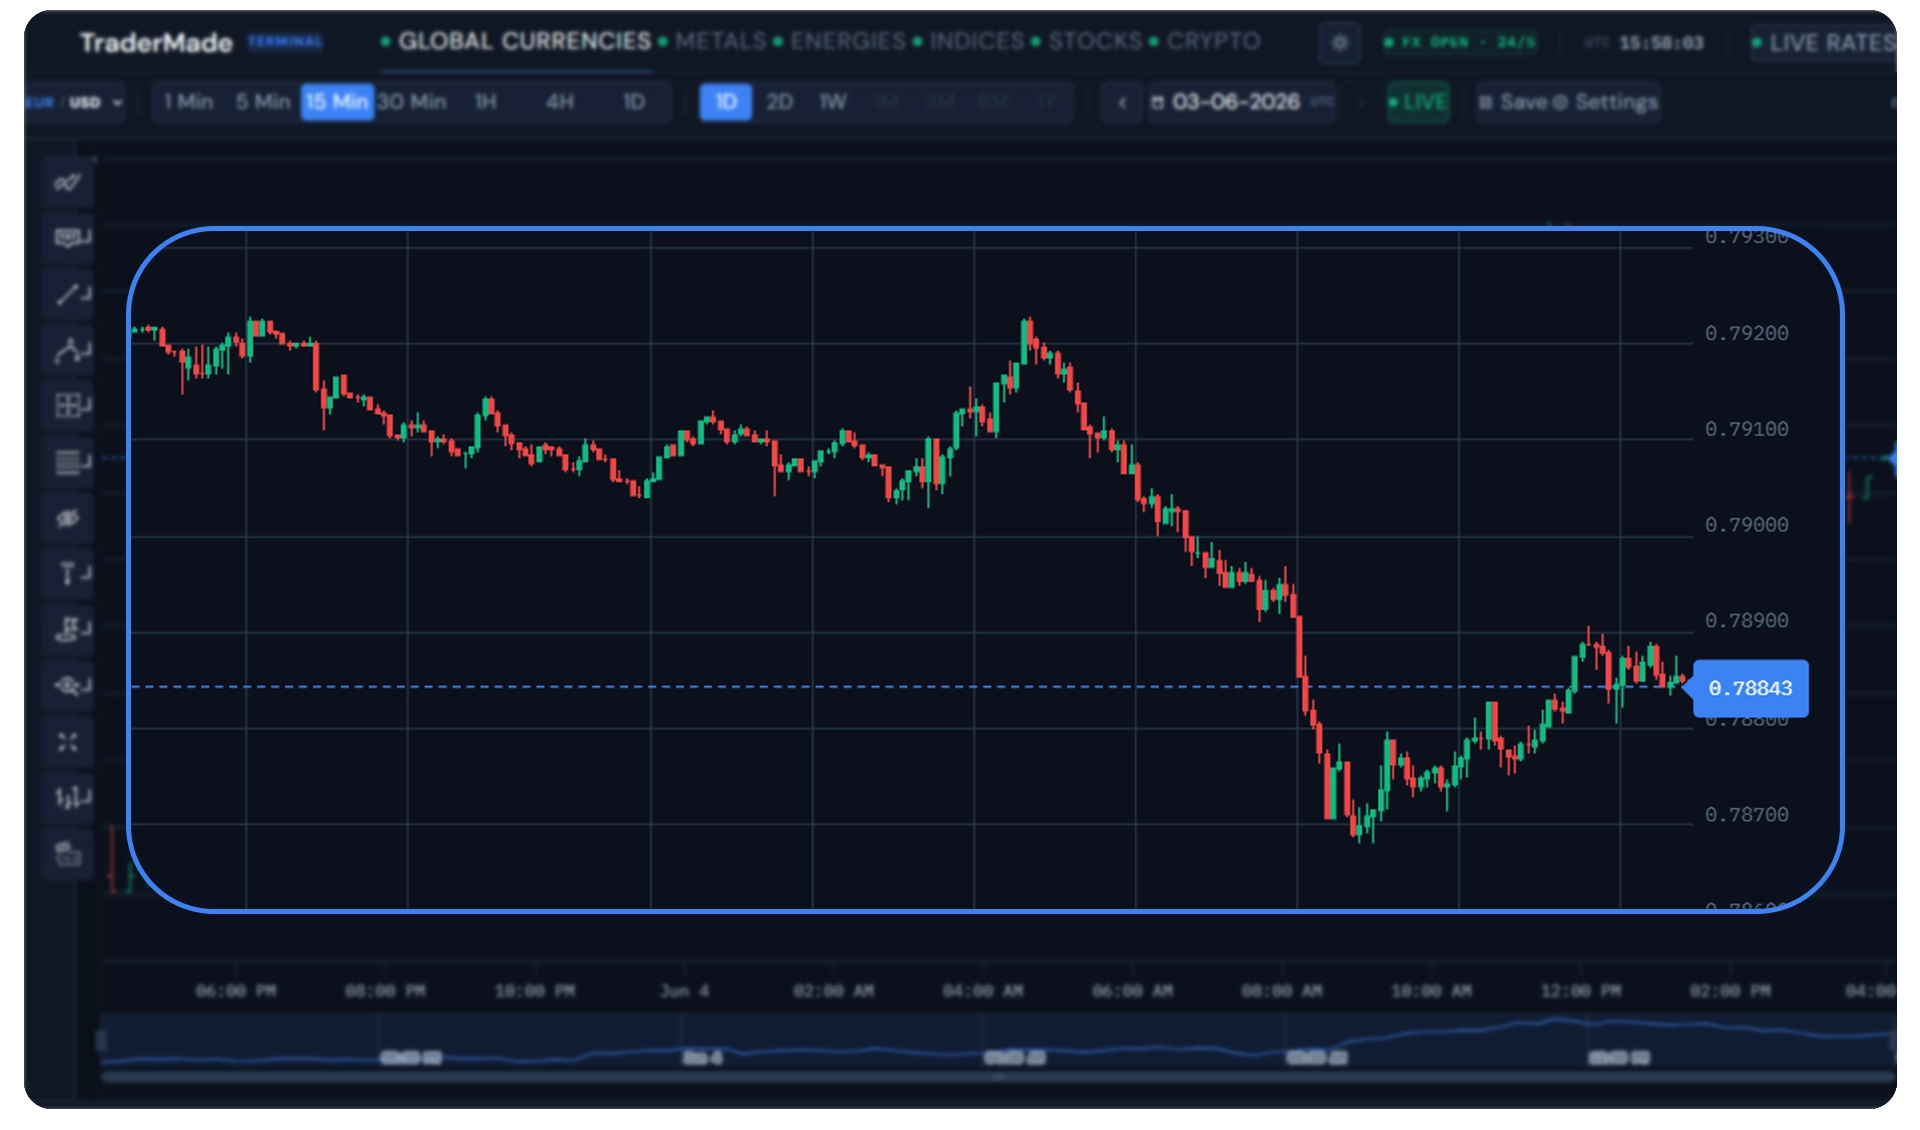
Chart Toolbar
The chart toolbar includes:
- Symbol picker
- Timeframe picker:
1 Min,5 Min,15 Min,30 Min,1H,4H,1D - Range presets:
1D,2D,1W,1M,3M,6M,1Y - Date navigation arrows
- Custom range picker
- LIVE button to return to current market data
- Save button
- Settings button
Range buttons are disabled when a timeframe cannot support that much history. For example, FX 1-minute and 5-minute data is capped at 48 market-open hours.
Date and Custom Range Picker
Click the date field in the toolbar to open the date-mode picker.
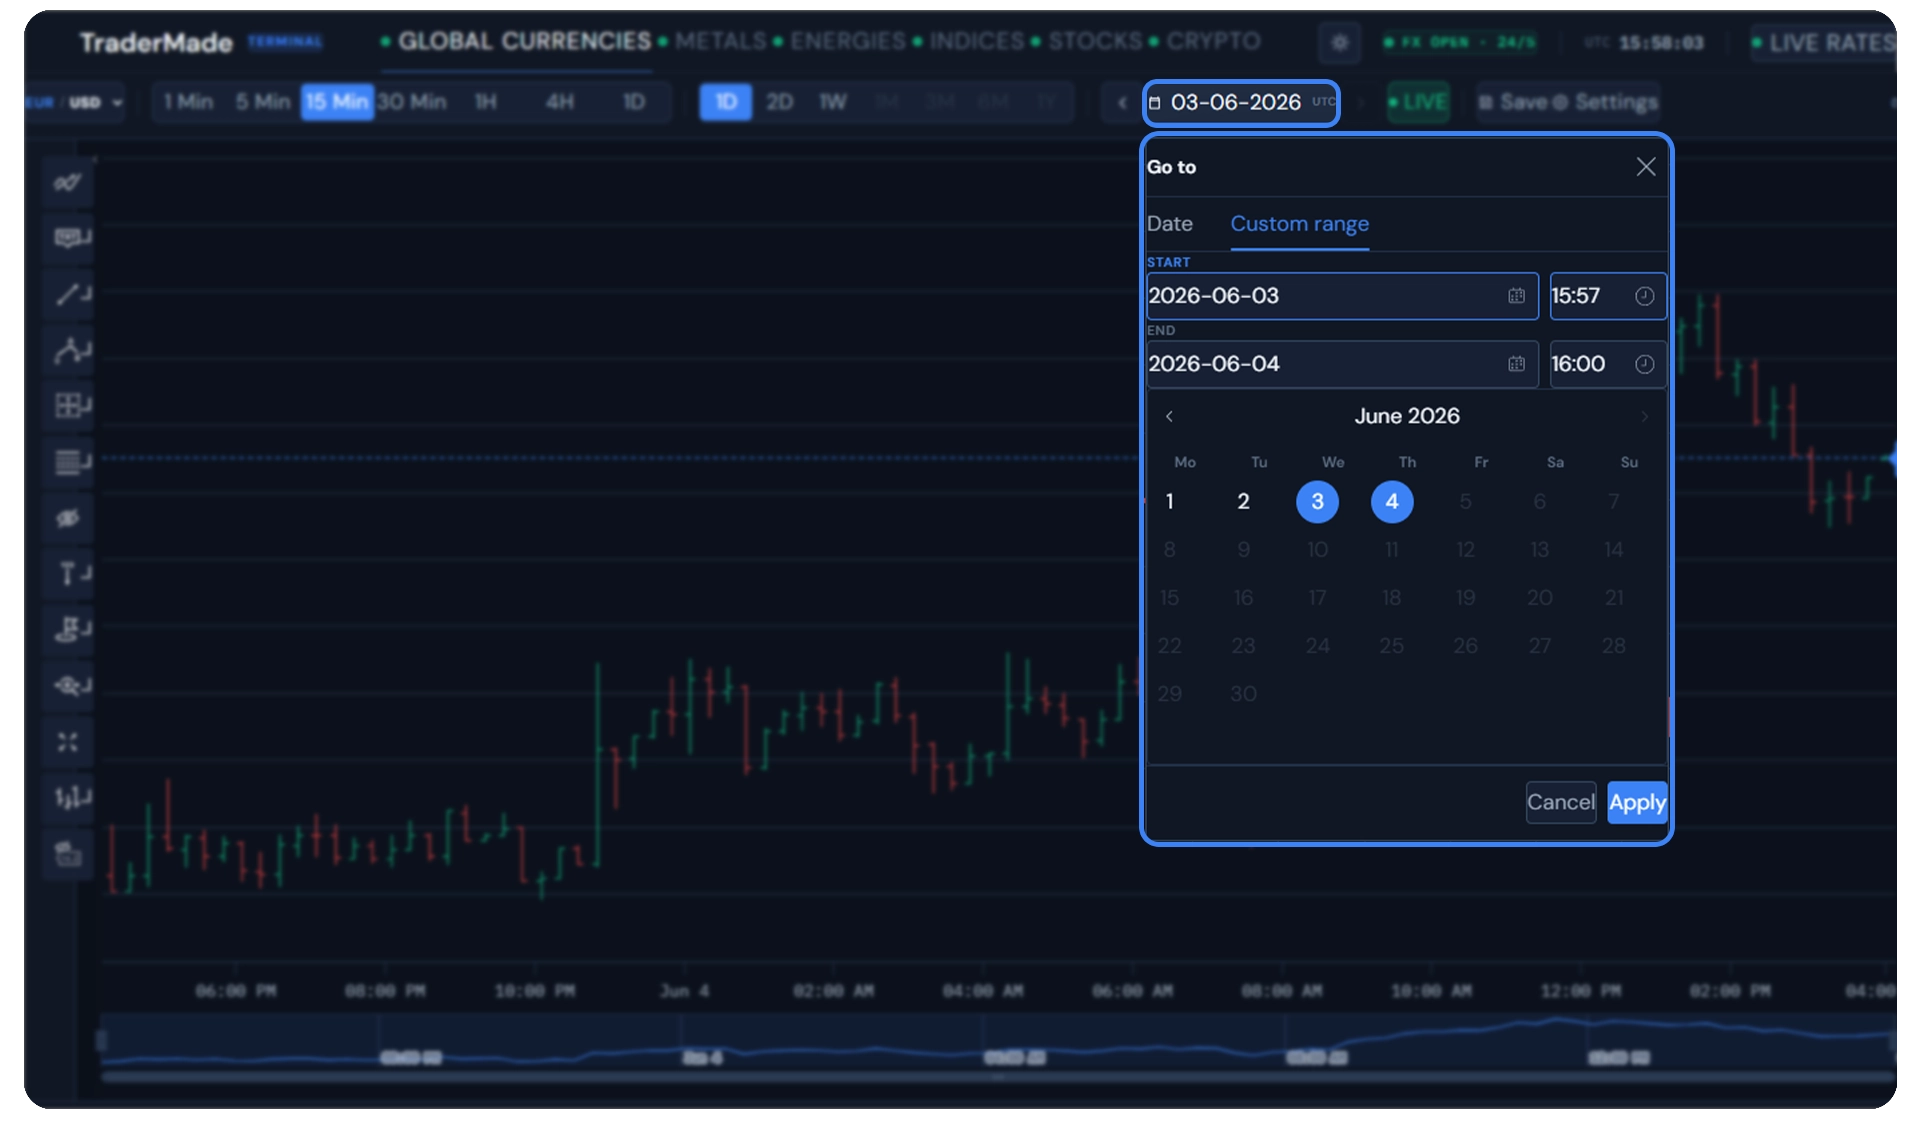
It has two modes:
- Date: jump to a specific historical date and time
- Custom range: choose a start and end date/time
When you select a six-month or one-month window, the date counter reflects the actual visible data range rather than only the end date.
Indicators
Click the indicators icon in the left Highcharts toolbar to add indicators such as:
- SMA
- EMA
- RSI
- MACD
- Bollinger Bands
- ATR
- Ichimoku
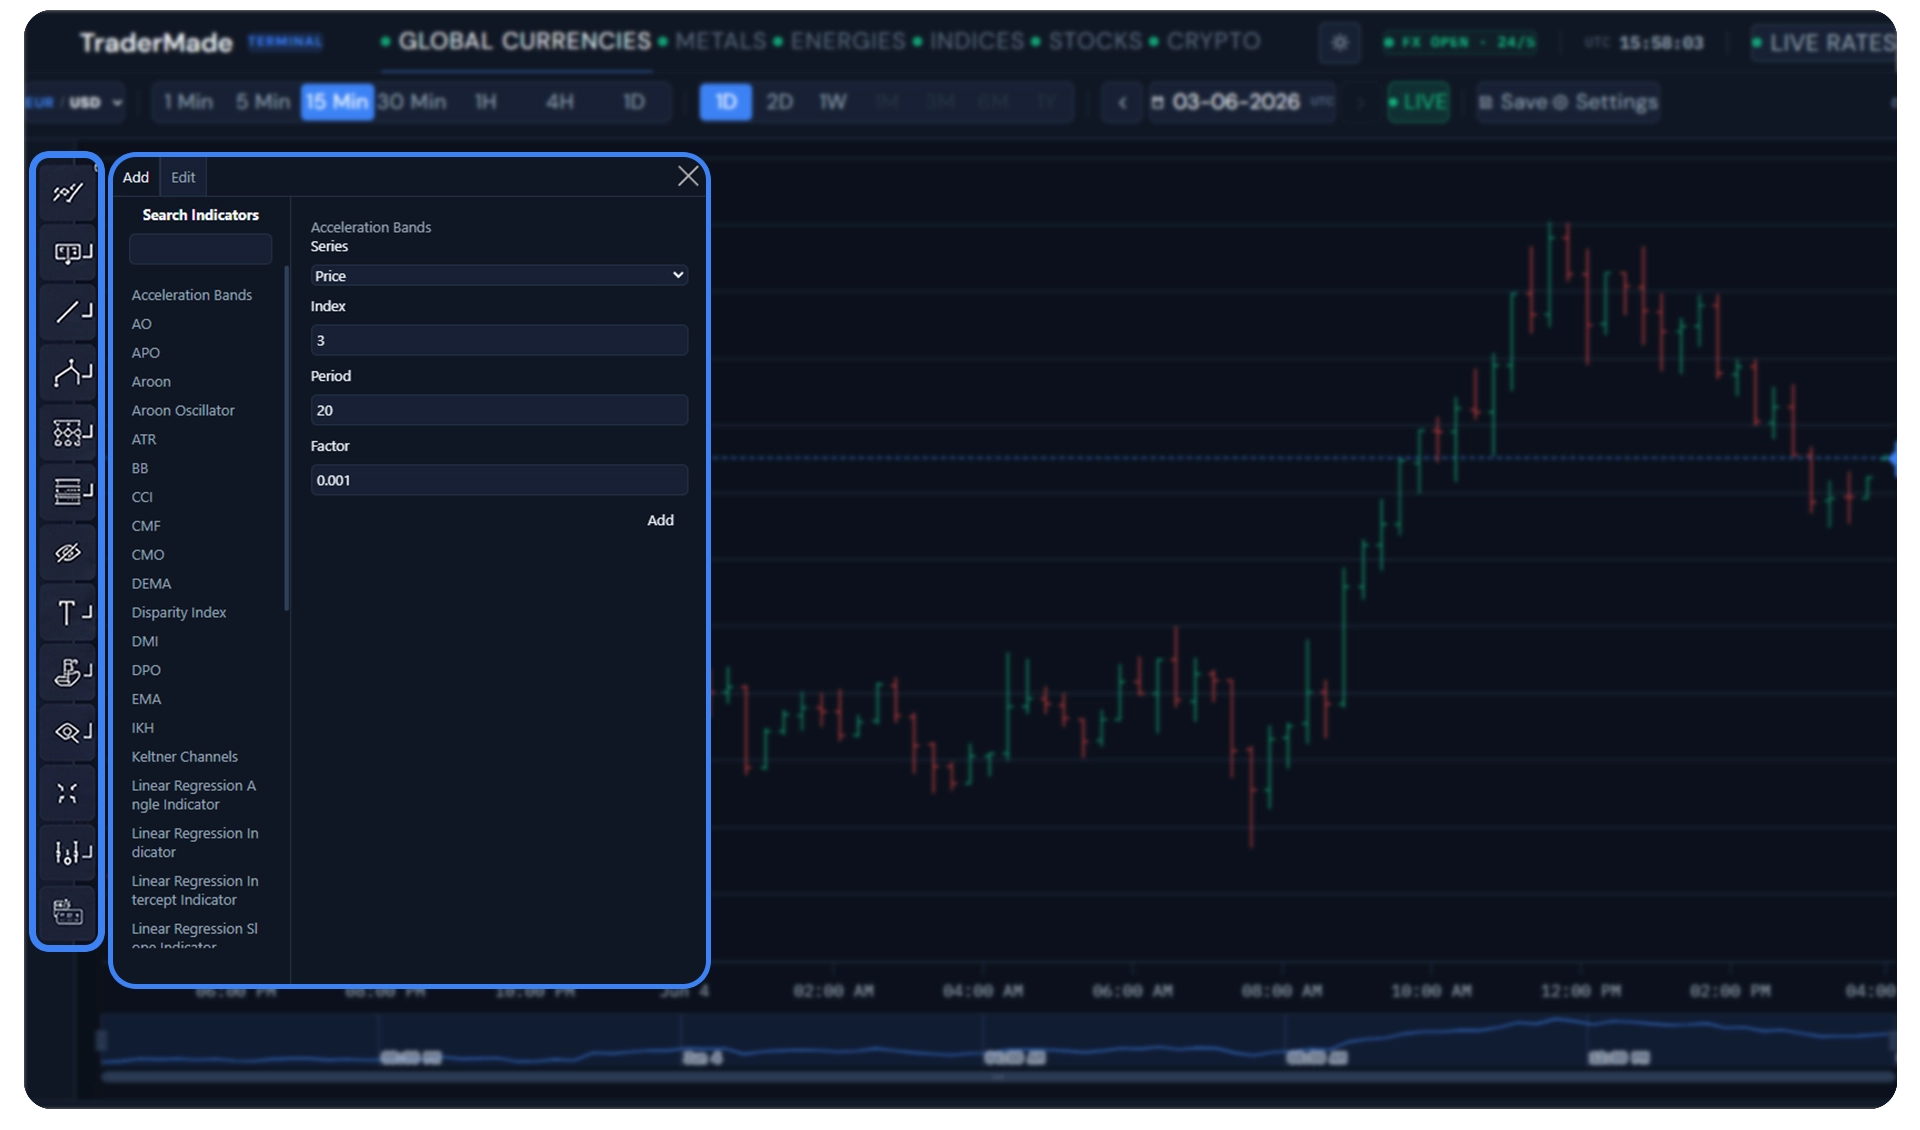
Indicators are global. If you add MACD on EUR/USD, it appears when you switch to GBP/USD, USD/JPY, crypto, or any other symbol. Indicators save automatically. You do not need to click Save for indicators.
Drawings and Annotations
Drawing tools are available from the left toolbar. You can add trend lines, rectangles, labels, Fibonacci tools, and other Highcharts stock-tools annotations.
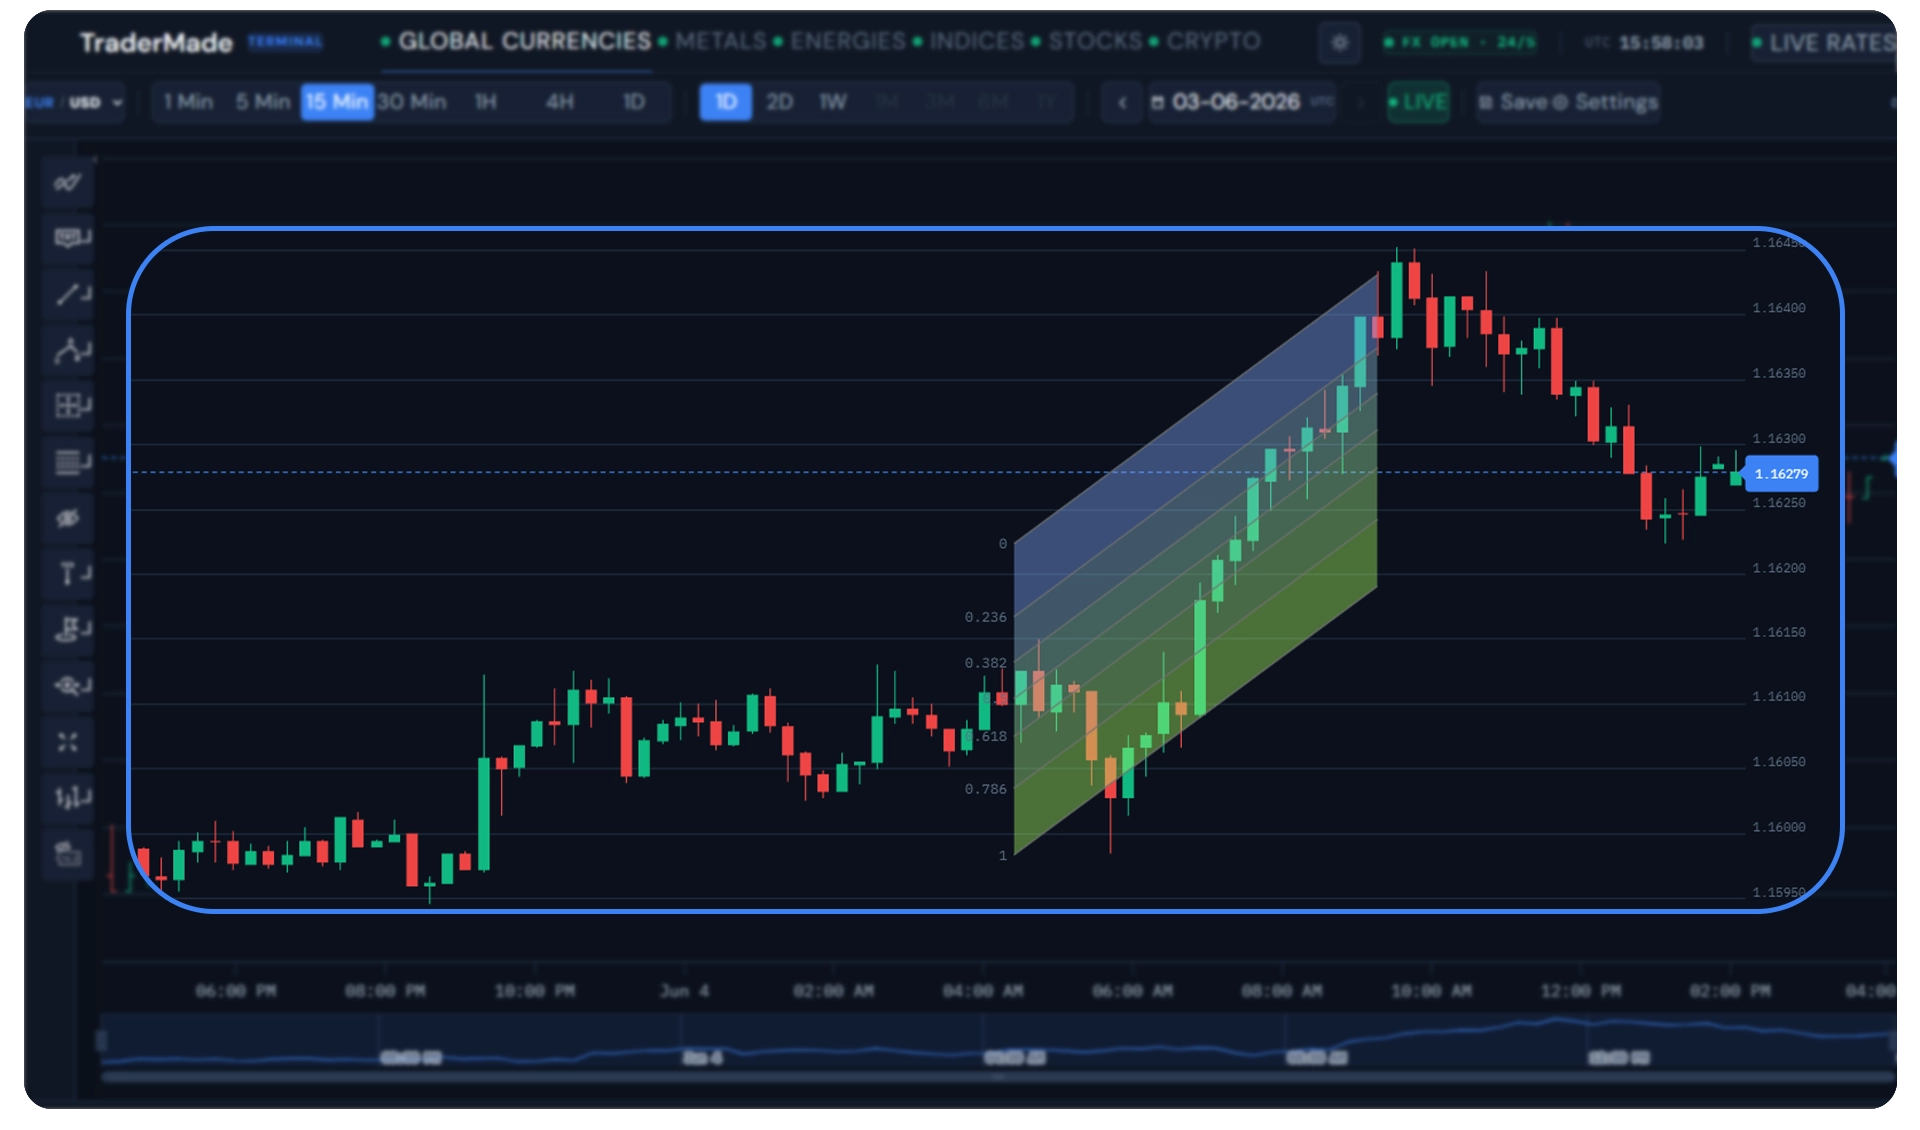 Drawings are per symbol and are saved only when you click Save. This keeps drawings from one symbol from appearing on every other symbol.
Chart Type
The toolbar supports chart type changes such as candlestick, OHLC, and line. Chart type is persisted globally, so switching symbols keeps the same visual mode.
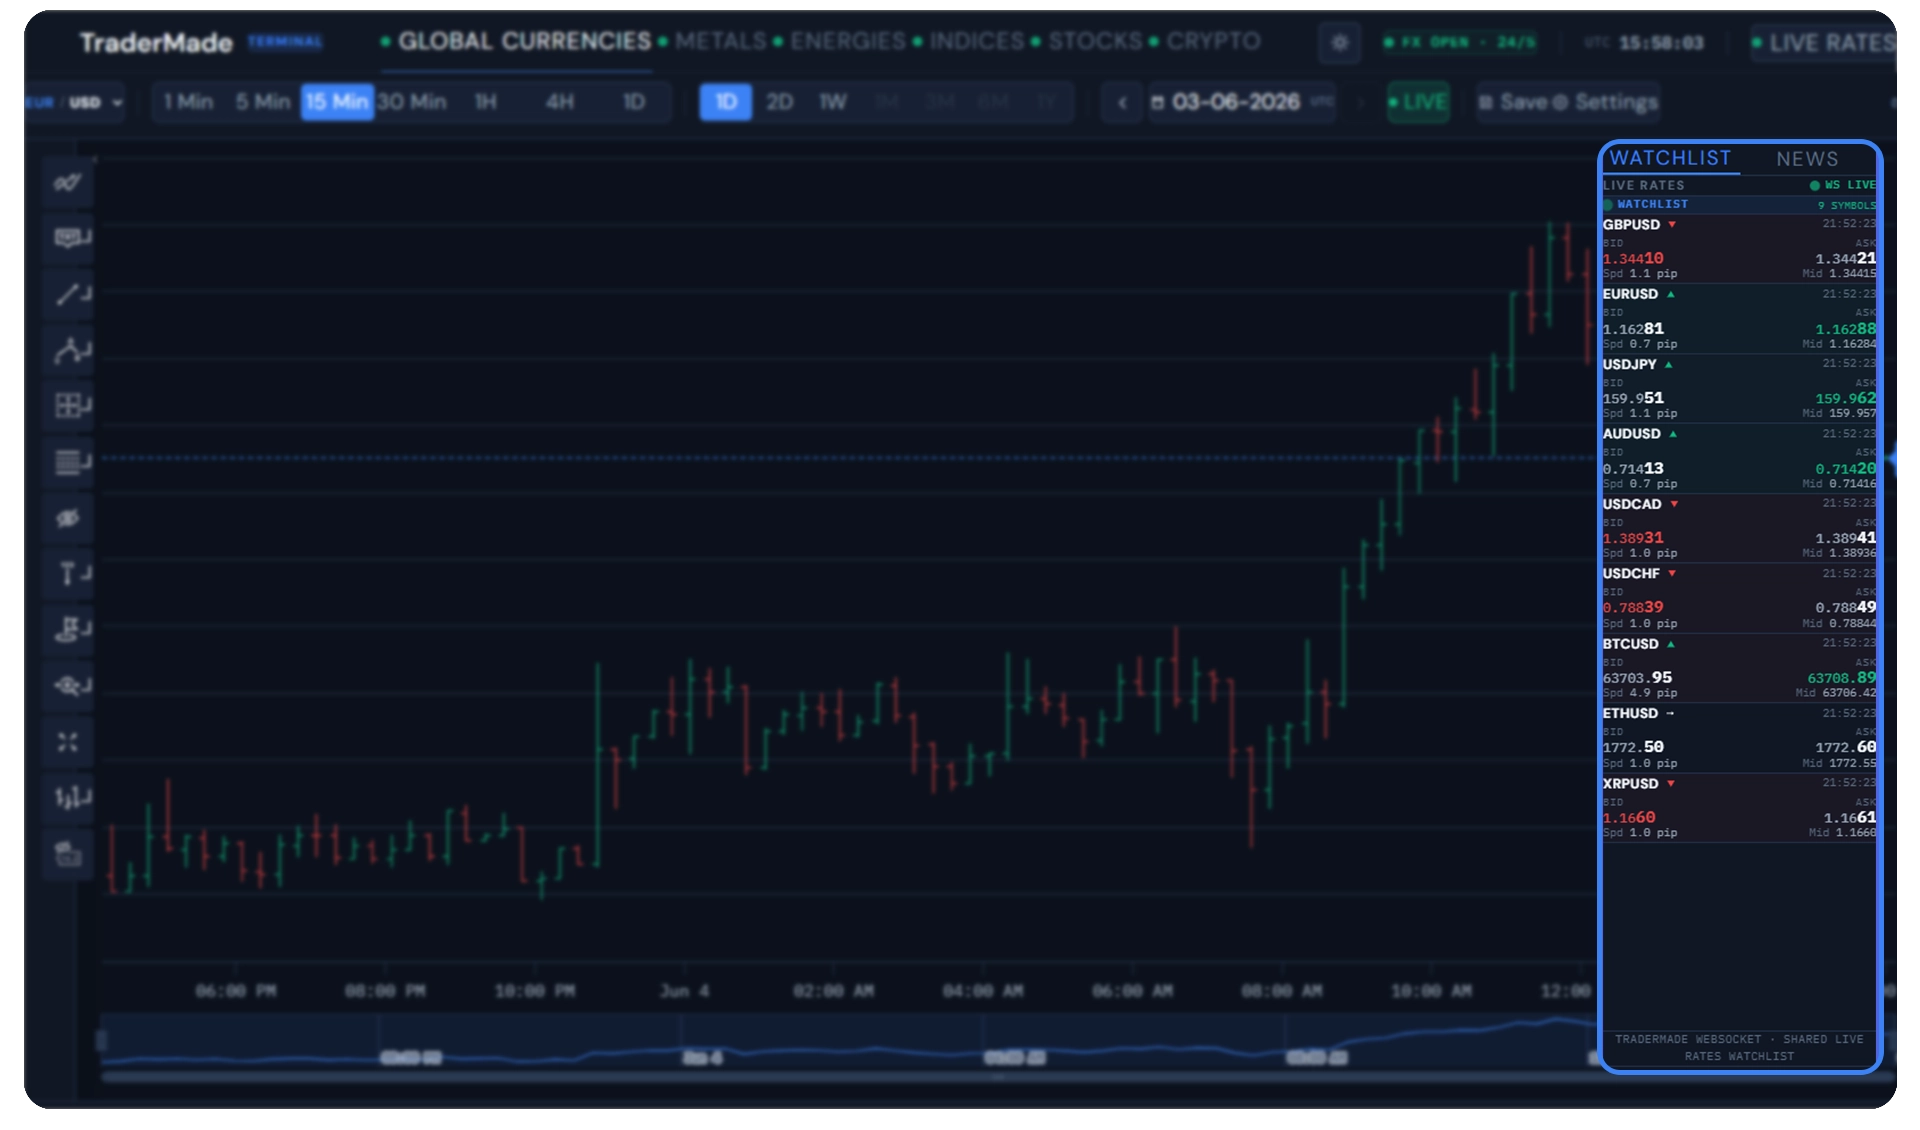
Watchlist
The right sidebar's Watchlist tab streams live bid/ask for every symbol you're tracking. Each row shows the symbol, a direction arrow for the latest tick, the time of that tick (UTC), bid and ask prices (with the last two pips rendered larger so micro-moves are easy to scan), spread in pips, and the mid price.
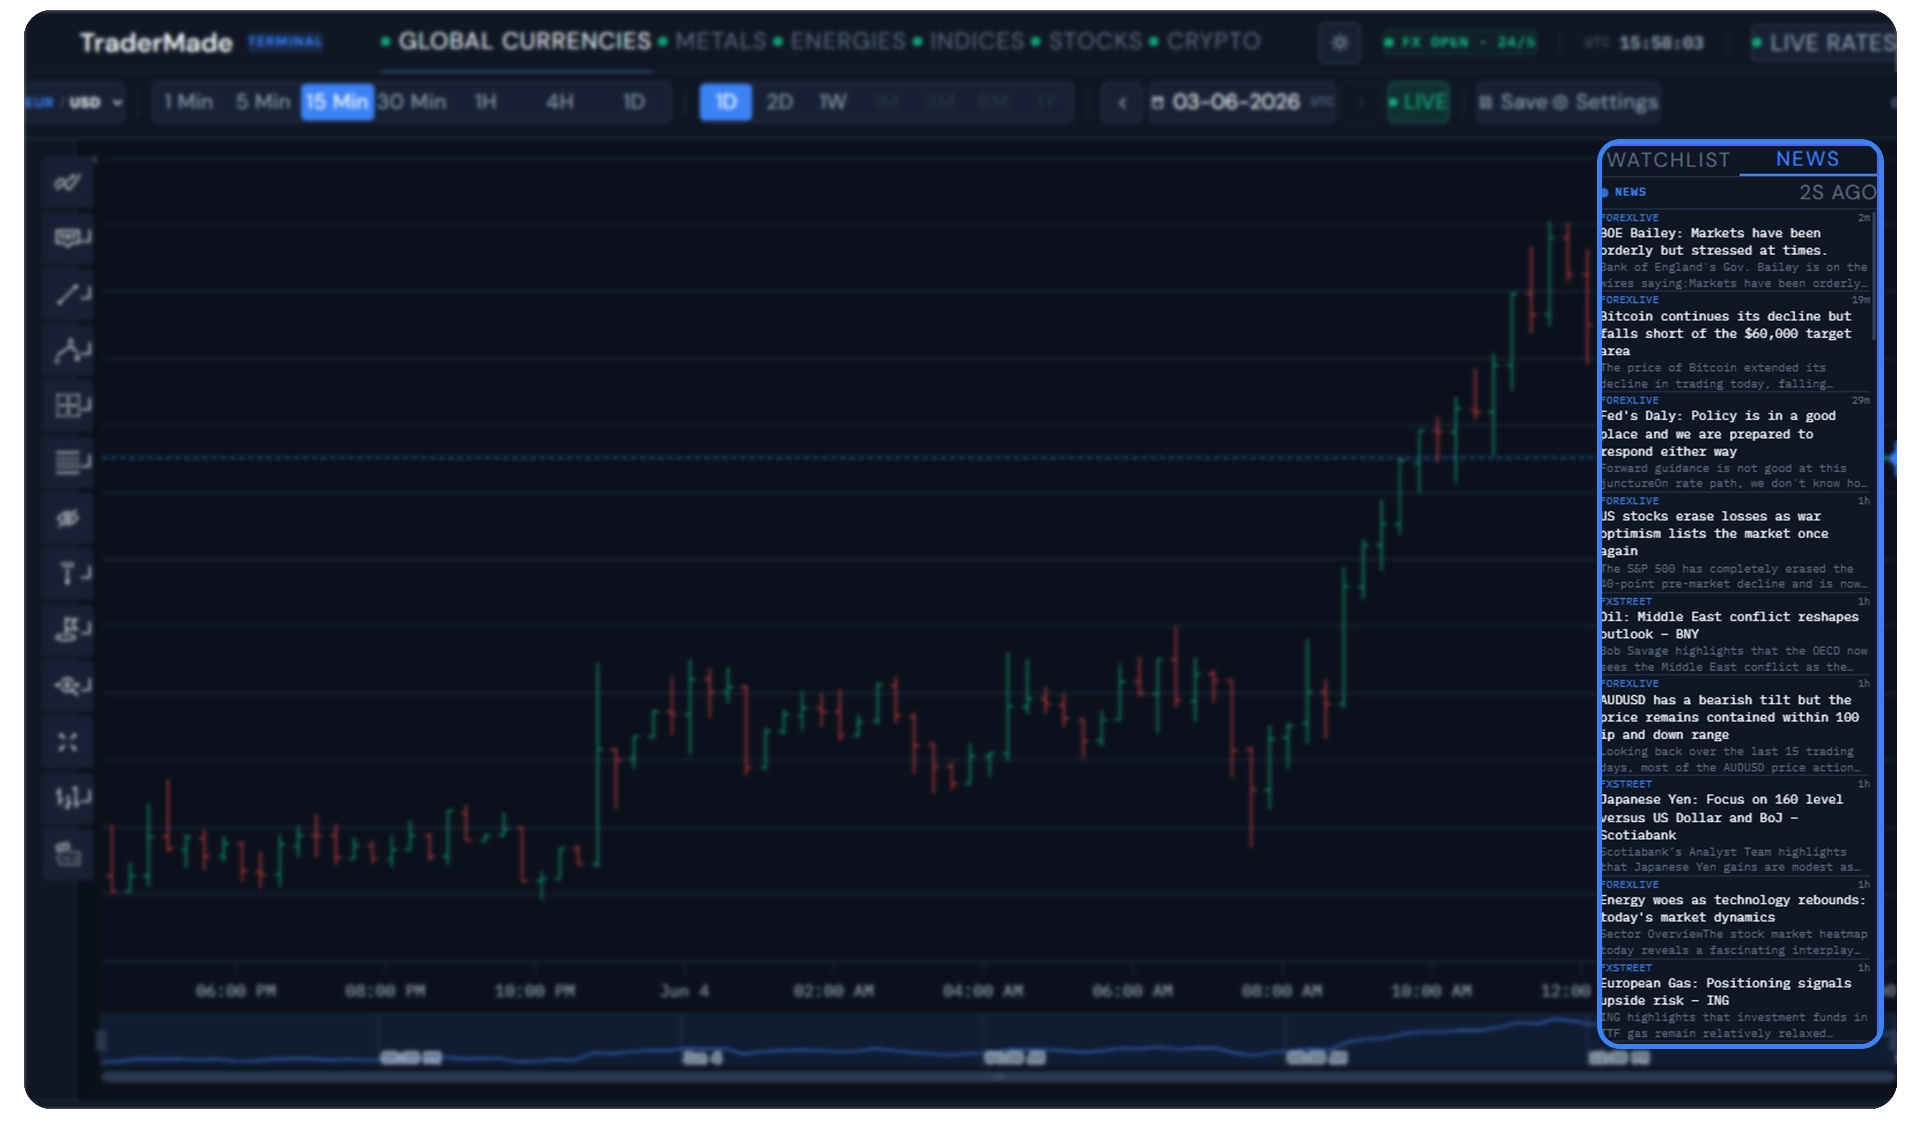
News
The News tab aggregates market headlines pulled server-side from ForexLive, FXStreet, and Investing.com. The Node server polls each RSS feed, parses the XML, deduplicates by URL, and caches the result for five minutes — the browser only sees one fast JSON endpoint at /api/news.
Settings
Open Settings to adjust:
- Bullish candle color
- Bearish candle color
- Accent color
- Chart background
- Grid color
- Light or dark mode
Settings are stored in localStorage.
The Settings panel also includes Reset chart layout. This clears saved indicators and chart type if a chart layout becomes stuck after experimenting with various indicators.
7. Run in Development Mode
For production-style local testing, use:
npm run build
node server.js
For frontend hot reload, run the backend and Vite separately:
Terminal 1:
node server.js
Terminal 2:
npm run dev
Open:
http://localhost:5173
💡 Note on Routing: When running in development mode via Vite (
port 5173), all API routes and local browser WebSocket calls are seamlessly mapped to your Express proxy on port3001via the pre-configured proxy middleware defined invite.config.js.
The Vite dev server runs the React frontend, while API and WebSocket traffic still go through server.js on port 3001.
8. Run with Docker
Docker is the easiest production-like deployment because it builds the frontend and runs the Node server in one container.
🛑 Pre-flight Check: You must ensure your completed
.envfile is present in the root directory before running the command below. Docker Compose evaluates environmental hooks during structural container builds; missing files will result in an unauthenticated architecture proxy environment.
Make sure .env exists first, then run:
docker compose up --build
Open:
http://localhost:3001
To stop:
docker compose down
The included docker-compose.yml maps port 3001 and reads secrets from .env.
9. Deploy to a Server
For a VPS deployment:
- Create a Linux server.
- Install Docker and Docker Compose.
- Copy the project and
.envto the server. - Run:
docker compose up -d --build
- Put it behind a reverse proxy with HTTPS.
A minimal Caddyfile:
terminal.your-domain.com {
    reverse_proxy localhost:3001
}
Caddy will automatically request and renew HTTPS certificates.
10. Customize Symbols and Branding
Change the Logo
Set VITE_LOGO_URL in .env:
VITE_LOGO_URL=https://your-domain.com/logo.png
Or add an image to public/ and reference it:
VITE_LOGO_URL=/my-logo.svg
Rebuild after changing Vite environment variables:
npm run build
node server.js
Change Default Symbols
Edit:
src/constants/constants.jsx
The market lists are plain arrays:
{ sym: "XAUUSD", base: "XAU", quote: "USD", name: "Gold / US Dollar", decimals: 2 }
You can add, remove, or reorder symbols in:
GLOBAL_PAIRSMETALS_CFDENERGIES_CFDINDICES_CFDUS_STOCKSCRYPTO_PAIRS
For stocks, the UI symbol can differ from the WebSocket symbol. For example:
{ sym: "AAPL", wsSym: "AAPLUSD", base: "AAPL", quote: "USD", name: "Apple Inc.", decimals: 2 }
11. Troubleshooting
Blank chart or "No quotes returned"
🚨 Critical Data Window Limitation: TraderMade clamps high-resolution intraday (1-minute and 5-minute) FX historical requests to a strict 48 market-open hours window.
If you are running or configuring this dashboard over a weekend (Saturday/Sunday), your default trailing charts might render empty or display "No quotes returned" because the market is closed and there are zero trailing ticks in that 48-hour calendar slice. To verify your platform connectivity during standard weekend closures, switch your chart timeframe tool to 1D (Daily) or open active 24/7 markets like Crypto.
API keys are not detected
Check .env:
TRADERMADE_API_KEY=...
TRADERMADE_WS_API_KEY=...
Restart node server.js after editing .env.
Port 3001 is already in use
Another copy of the server is already running. Stop it, or run with a different port:
PORT=3002 node server.js
On Windows PowerShell:
$env:PORT=3002
node server.js
Production Scenarios
A charting stack isn't worth building if a SaaS already does the job — TradingView's free tier is honestly excellent for most personal use. Self-hosting starts paying off the moment you need something the hosted options can't give you. Four situations where that crossover usually happens:
Fintech startup building a trading product. Wiring a charting frontend, a market-data backend, a WebSocket pipe, and a watchlist from scratch is a 2–4 week build for a competent dev. Cloning this gets you to a working surface in an afternoon. The saved weeks go into what actually differentiates your product — order routing, your own data tier, your trading logic.
Internal tool for a trading desk or prop firm. Bloomberg runs around $24k/year per seat. Refinitiv isn't far off. For a small team that mostly needs charts, watchlists, and news, one TraderMade plan shared across the whole team covers what most users actually touch. Drop in SSO, wire it to your internal symbol universe, host it on a VPS.
Solo trader who wants their own setup. No third party tracking your watchlist or your trading patterns. Runs on your laptop, your state lives in your browser. And because you own every line, custom alerts, Discord webhooks, or that obscure indicator nobody else ships — you just add them.
Startup building mvps When you are rushing to prove product-market fit, you don't have time to spend weeks building a charting interface from scratch. This stack lets you deploy a fully functional multi-asset MVP in an afternoon, allowing you to instantly show investors and early users a working layout while you focus on your core proprietary features.
Conclusion
You now have a self-hosted TraderMade-powered trading terminal with live market data, historical charts, real-time candle updates, technical indicators, symbol watchlists, news, settings, and Docker deployment.
The complete, production-tested source code for this project is available on GitHub. You can star, fork, or clone the repository here: 👉 TraderMade Charting Portal Repository on GitHub
If you'd like this tailored to your own data feed, custom indicators, white-labelled branding, internal-tool integrations, or anything else specific to your business, book a call at Book a call — happy to scope something out with you.
If there's a feature you'd like added, mail us at support@tradermade.com for the pricing and other details.