Technical indicators are needed for in-depth market analysis and data-driven, informed decision-making. In this tutorial, we will guide you through fetching historical forex data using the TraderMade API and calculating key technical indicators using the Python TA-Lib library. By the end, you'll have all the tools needed to incorporate these indicators into your apps, platforms and trading systems.
Our API delivers real-time data on a wide range of tradable assets, including over 32 US stocks, 10 major indices, precious metals, and access to over 100 currencies (explore currencies & CFDs).
Before getting started, we need to ensure you have the TA-lib library, one issue is that pip is not a great way of downloading this library as it fails to build on some machines, especially windows. Hence, we will show you a way to download the library that can be used to get any library using the wheel file.
For Linux please refer to the official TA-lib library.
First visit the ta-lib windows wheel page then download the appropriate wheel, check what version of python you are running and whether your computer is 32 or 64 bit. Make sure you're running pip from the same location your whl file is.
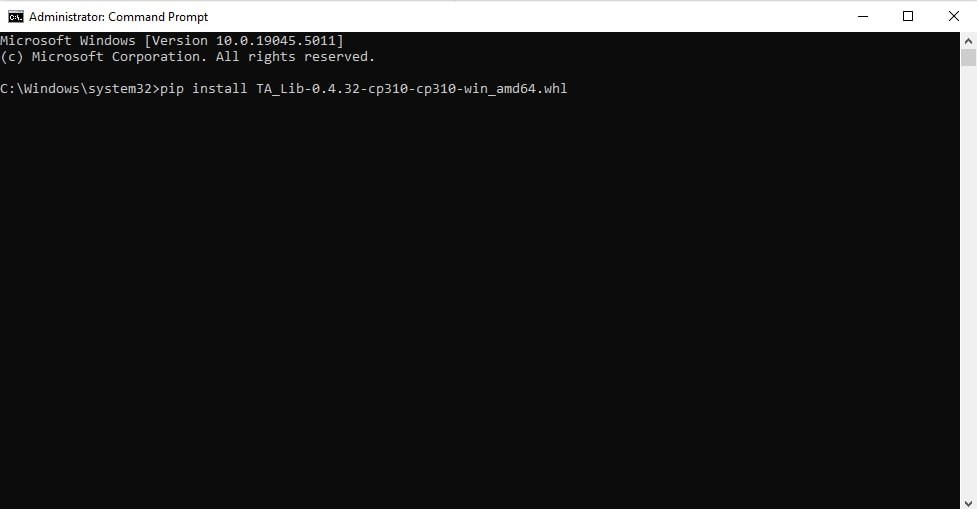
As you can see below we have downloaded a whl file that supports 64 bit computers and uses python 3.10. Hence the following download:
pip install requests pandas
pip install TA_Lib-0.4.32-cp310-cp310-win_amd64.whl

Once you have successfully installed the library, sign up and obtain your free Forex API key from TraderMade. Then install tradermade for easy integration.
pip install tradermade
Step-by-Step Guide
Step 1: Import Libraries
Begin by importing the necessary libraries for data requests, manipulation, and analysis.
import talib
import tradermade as tm
Step 2: Set Up Your API Key
Replace your TraderMade API key for authentication.
# Replace Your TraderMade API key
tm.set_rest_api_key("api_key")
Step 3: Function to Fetch Market Data
Create a function to retrieve historical forex data for a specific currency pair within a desired date range.
tm.timeseries(currency='EURUSD', start="2024-08-05",end="2024-11-04",interval="daily",fields=["open", "high", "low","close"])
Step 4: Calculate Key Technical Indicators
You can calculate tens of indicators including candlestick pattern recognition here is a full list of ta-lib functions. Now, calculate some essential technical indicators that traders commonly use:
1) Simple Moving Average (SMA)
A commonly used indicator to smooth out price data over a specified period (20 days in this case).
2) Relative Strength Index (RSI)
It is a momentum oscillator. RSI calculates the price movement's speed and change. It is used to identify overbought or oversold conditions.
3) Moving Average Convergence Divergence (MACD)
This indicator examines the relationship existing between two moving averages of a currency pair or financial instrument, helping to identify potential shifts in market momentum. MACD shows the relationship between two moving average’s prices, useful for identifying potential buy/sell signals.
# Calculate technical indicators using TA-Lib
df['SMA_20'] = talib.SMA(df['close'], timeperiod=20) # 20-period Simple Moving Average

df['RSI_14'] = talib.RSI(df['close'], timeperiod=14) # 14-period Relative Strength Index
df['MACD'], df['MACD_signal'], df['MACD_hist'] = talib.MACD(df['close'],
                                                                  fastperiod=12,
                                                                  slowperiod=26,
                                                                  signalperiod=9)
Step 5: Display the Results
Finally, print the last few rows of the DataFrame to view the OHLC data along with the calculated indicators.
df = df.set_index("date")
df = df.dropna()
print(df.head())
              open     high      low    close    SMA_20     RSI_14      MACD  MACD_signal  MACD_hist

date
2024-09-19  1.11172  1.11790  1.10686  1.11621  1.109625  62.318384  0.003357     0.003439  -0.000083
2024-09-20  1.11626  1.11820  1.11362  1.11631  1.109472  62.410940  0.003576     0.003467   0.000109
2024-09-23  1.11646  1.11674  1.10834  1.11114  1.109223  54.902623  0.003295     0.003432  -0.000138
2024-09-24  1.11114  1.11811  1.11036  1.11797  1.109199  61.493338  0.003582     0.003462   0.000119
2024-09-25  1.11799  1.12141  1.11217  1.11329  1.109263  55.507279  0.003392     0.003448  -0.000056
Full Code
Here is the full code; please go through it.
# Display the data with indicators

import talib
import tradermade as tm

tm.set_rest_api_key("api_key")

df = tm.timeseries(currency='EURUSD', start="2024-08-05",end="2024-11-04",interval="daily",fields=["open", "high", "low","close"])

df['SMA_20'] = talib.SMA(df['close'], timeperiod=20) # 20-period Simple Moving Average

df['RSI_14'] = talib.RSI(df['close'], timeperiod=14) # 14-period Relative Strength Index
df['MACD'], df['MACD_signal'], df['MACD_hist'] = talib.MACD(df['close'],
                                                                  fastperiod=12,
                                                                  slowperiod=26,
                                                                  signalperiod=9)

df = df.set_index("date")
df = df.dropna()
print(df.head())
Conclusion
This tutorial showed you how to fetch historical forex data using the TraderMade SDK and calculate essential technical indicators like SMA, RSI, and MACD using the TA-Lib library. But this tutorial barely scratches the surface on what is possible. There are 100+ indicators including candlestick patterns that can be used on any market of your choice.
If you like our easy to use guide please share our tutorials, or mention in your own blogs. If you have any questions or need further assistance installing TA-lib, don’t hesitate to ask. Happy Coding!


