

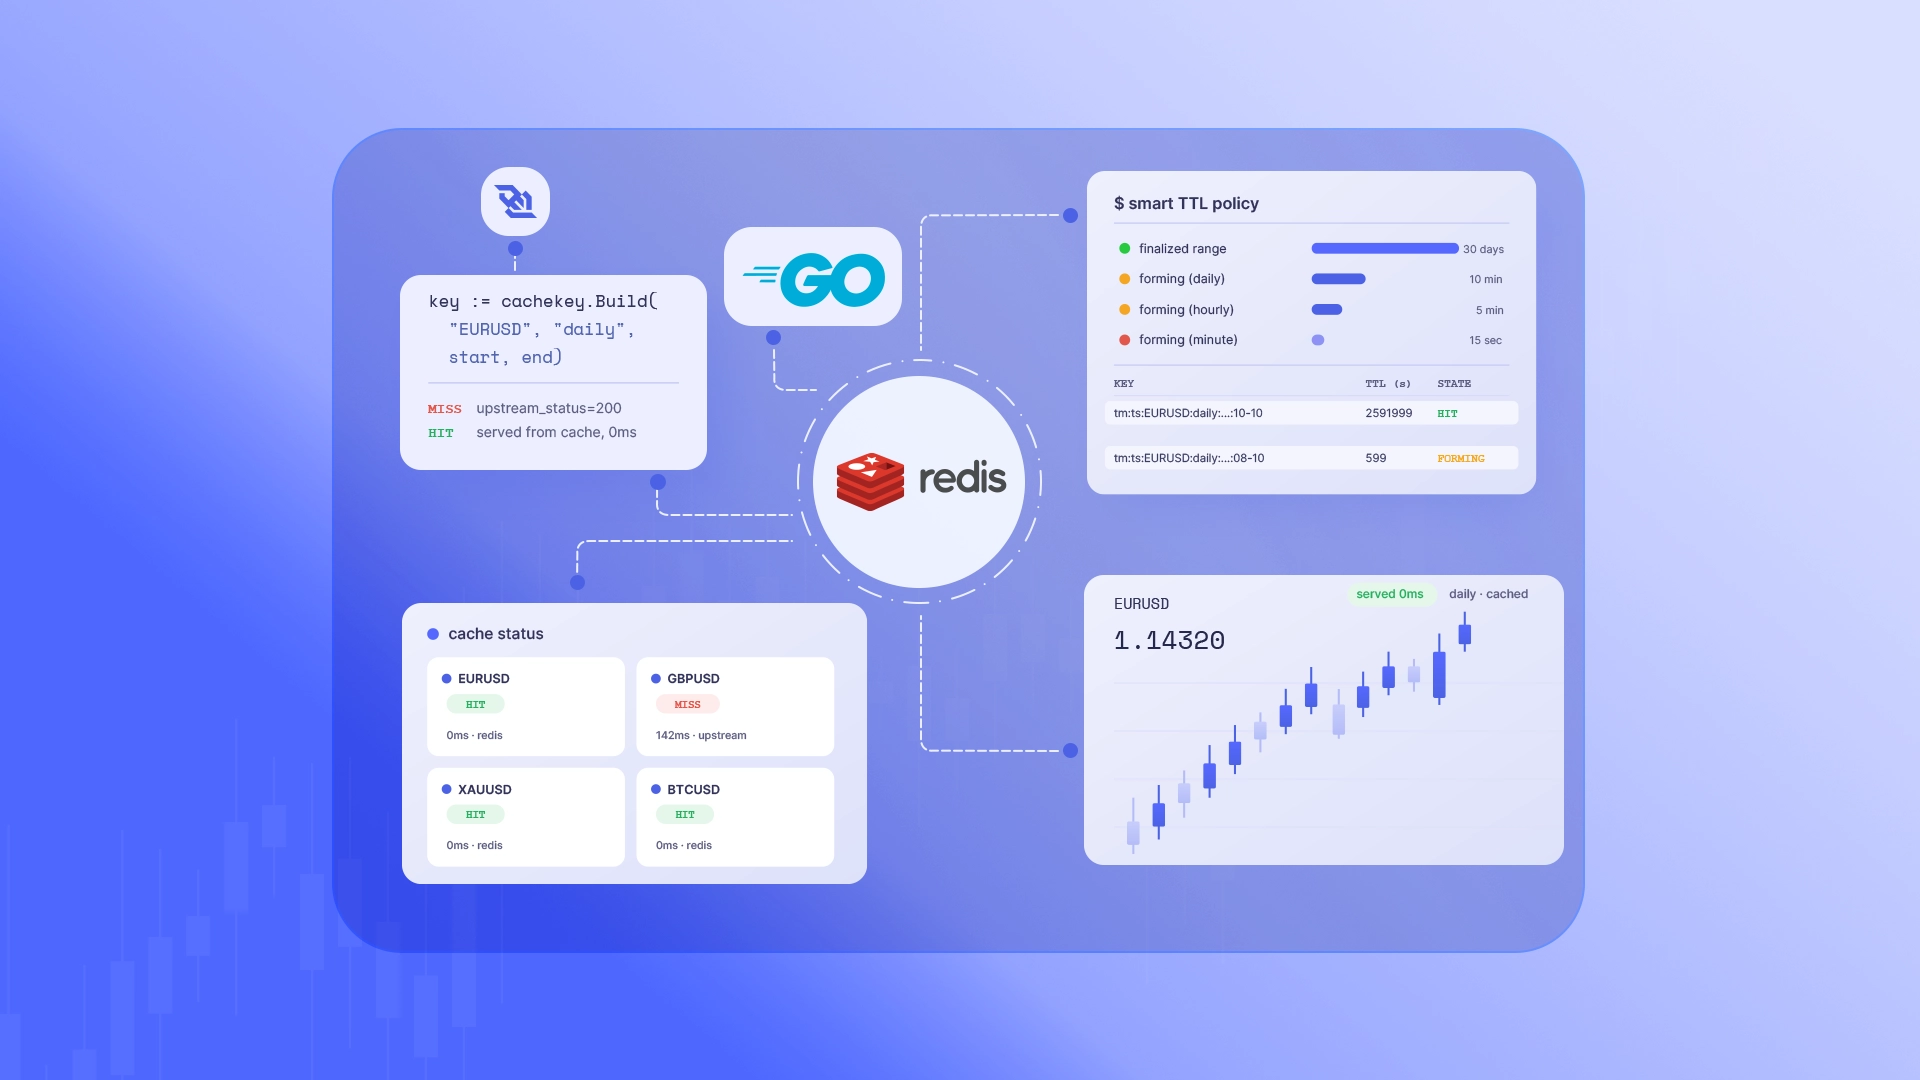
Querying a full year of daily EURUSD timeseries data over an HTTP connection requires transmitting over a thousand data points across the network. Serving that same dataset locally from a Parquet file takes under 2 milliseconds. If your trading platform loads popular charts repeatedly — and every platform does — eliminating that network overhead is what your users feel as an instant screen instead of a spinner.
In this guide you'll work through the layer that fixes it: a small open-source Go service that puts Redis and Parquet in front of timeseries, so repeated requests are answered from memory or local disk instead of a network call. You'll clone a working reference implementation, run each part locally, read the code that makes each design decision, and measure the speedup yourself — so you understand exactly how it works and can adapt the approach (or the repo itself) to your own stack, whatever data provider you use.
What you'll learn
- How to cache your
/timeseriesdata from any market data provider using Redis - How to use a persistent Parquet storage layer to prevent data gaps, staleness, and redundant API calls during service restarts
- How to load and maintain years of historical OHLC data efficiently using a lightweight fetcher
Prerequisites
Make sure you have the following installed on your system:
- Go 1.26+: Powers the lightweight, high-performance caching service that routes incoming market-data requests.
- Docker: Runs local Redis and storage containers seamlessly without manual database installation.
- Python 3.10+: Used for running the historical data fetcher script and performance benchmarking. Install the required packages before running any of the scripts below:
bash pip install pandas pyarrow requests - Git: Required to clone the project repository.
- Timeseries API key: Required for fetching historical market data. The repo below ships wired up to TraderMade's API; the caching pattern itself — Redis in front, Parquet behind — applies to any timeseries provider, but adapting the fetcher and Go handlers to a different API is on you.
Key Components
- Redis: An in-memory cache that delivers sub-millisecond responses for active, repeated user requests.
- Parquet: A fast, compressed column-based file format that stores historical data on disk, preserving data through restarts without expensive API re-fetches.
TraderMade Customer? If you're already using TraderMade, you don't need to write this from scratch! We've built and optimized this entire Go + Python caching system for you. Check out the TraderMade Redis Cache GitHub Repository, follow the README, and get it production-ready in minutes.
Step 1: Turn a slow call into an instant one
To understand why chart loading feels slow on un-cached platforms, let's look at the underlying issue. Open a terminal and send a curl request for a full year of daily EURUSD data:
curl "http://localhost:8080/timeseries?currency=EURUSD&start_date=2023-01-01&end_date=2023-12-31&interval=daily"
A single year of daily forex data contains around 260 trading days. Because each candle returns 5 data points (timestamp, open, high, low, close), the upstream API must query, format, and transmit over 1,300 individual data points in a single JSON payload. Fetching and parsing this volume of data over an HTTP connection is why requests take noticeable time whenever users load a chart on your platform.
When you send this initial request through our caching service, the server logs a cache MISS while fetching the data from the provider:
[tm-cache] MISS key=tm:ts:EURUSD:daily:1:2023-01-01:2023-12-31:records ... stored ttl=720h0m0s
Now, run the exact same curl command a second time:
curl "http://localhost:8080/timeseries?currency=EURUSD&start_date=2023-01-01&end_date=2023-12-31&interval=daily"
The response comes back almost instantly because it is served directly from local memory instead of reaching across the network. The service log shows a cache HIT:
[tm-cache] HIT key=tm:ts:EURUSD:daily:1:2023-01-01:2023-12-31:records (served from cache, no upstream call)
The first request was a MISS: it fetched from the API and saved the result to Redis. The second was a HIT: it returned directly from Redis with zero external network overhead. You pay the network latency cost once per date range, not once per user request.
Now, how long should each answer stay cached? That's the ttl=720h above — 30 days. The rule is simple:
- If the date range has already ended, the data can't change, so keep it a long time (30 days).
- If the range runs up to today, today's candle is still forming, so keep it only a few minutes, then refetch.
The service works this out from the end date alone — it doesn't need an extra call to decide. That's the whole rule, in one function:
// internal/config/config.go
func (c Config) TTLFor(interval, endDate string, now time.Time) time.Duration {
    if Finalized(endDate, now) {           // end date is in the past?
        return c.FinalizedTTL              // yes → keep 30 days
    }
    return c.formingTTL(interval)          // no  → keep minutes, then refetch
}
Finalized just checks whether the requested end date is before today. If it is, the range is closed and safe to keep; if not, it's still moving, so the cache holds it briefly. (A request for an end date beyond today falls into the same "not finalized" branch — it gets the short TTL rather than an error, which is reasonable, but worth being deliberate about if your API layer should instead reject those ranges outright.)
Step 2: Keep the data when Redis restarts
To make your system resilient, you need to understand what each storage layer actually does:
- Redis (In-Memory Cache): Stores recent responses in memory for ultra-fast (sub-millisecond) reads. It holds both active, forming candles (for a few minutes) and closed historical ranges (for 30 days). However, because memory is temporary, a Redis restart or crash clears everything out.
- Parquet (Local Disk Storage): Acts as your permanent fallback. It stores only finalized, closed historical candles (past dates that never change). Because these are saved as compressed files on your disk, they survive restarts, reboots, and cache flushes.
How the 3-Layer Fallback Works
When a user requests chart data, your service checks three places in sequence and returns as soon as it finds the data:
request → Redis?    hit  → return (sub-millisecond)
                    miss ↓
        → Parquet?  hit  → return, and refill Redis   (no API call)
                    miss ↓
        → TraderMade API → return, save to Redis + Parquet
Let's prove it works. Fetch a past range, check that the file was created, clear Redis completely, then fetch the same range again:
curl "http://localhost:8080/timeseries?currency=EURUSD&start_date=2024-02-01&end_date=2024-02-10&interval=daily"
ls data/EURUSD/daily/1/
docker exec tm-cache-redis redis-cli FLUSHALL
curl "http://localhost:8080/timeseries?currency=EURUSD&start_date=2024-02-01&end_date=2024-02-10&interval=daily"
Redis was empty for that last request, but it still didn't call the API. The log shows the data came from the Parquet file:
[tm-cache] ARCHIVE key=tm:ts:EURUSD:daily:1:2024-02-01:2024-02-10:records (served from parquet, no upstream call)
The data was on disk, so it came from there. Parquet is also a format that pandas and DuckDB read directly, so the same files you cache are ready to use for backtesting.
Step 3: Load history ahead of time
The majority of systems only save data when a user asks for it. But you don't have to wait around for users to click on charts to fill up your cache.
When setting up your platform, it's advisable to pre-load history for your main trading pairs right at the start. For instance, the TraderMade timeseries API provides 12 years of daily data and 1 year of hourly data, which is more than sufficient for most charts.
We built a simple script (fetcher.py) that grabs this historical data in small, safe chunks and saves it straight to local Parquet files:
python fetcher.py --api-key=YOUR_KEY --symbols EURUSD --intervals daily --years 3
When you run it, you'll see output like this:
EURUSD [daily]: 37 batch(es), 2023-08-23 -> 2026-08-19
  ...
  Done: EURUSD -> timeseries_data/EURUSD_daily.parquet (780 rows total)
Smart Fetching Rules
The script comes with two built-in design choices that make production caching effortless:
- Incremental Updates: If you run the fetcher again tomorrow, it won't re-download years of history. It checks your existing Parquet file, finds where it left off, and only requests the missing days to keep your system updated.
- Only Completed Candles: The script intentionally lags behind real-time (by 2 days for daily data, 3 hours for hourly, and 2 minutes for minute data). This ensures it only stores permanently closed candles—never an incomplete candle that's still changing.
If you have 20–30 prominent symbols that your platform supports, running this script once caches all their historical data and leaves your system fully set up. After that initial run, appending new daily bars is extremely lightweight, keeping your pipeline simple without needing complex cron jobs or handling complexity to fill the unfinalized candles.
Pro Tip: Only preload the popular trading pairs your platform actually uses (like EURUSD or BTCUSD). For rare or obscure pairs, let the on-demand cache handle them whenever a user happens to look them up.
Step 4: Generate custom timeframes without extra API calls
A common mistake when building chart systems is fetching every single timeframe (5-minute, 15-minute, 4-hour) directly from the API. That wastes your rate limits and clutters your disk space.
Instead, you only need to store three base intervals: 1-minute, 1-hour, and daily. Any custom timeframe can be built locally in real time by resampling your stored data.
How to Resample Data
First, fetch 3 days of 1-minute data using the fetcher script:
python fetcher.py --api-key=YOUR_KEY --symbols EURUSD --intervals minute --days 3
Now, instead of calling the API again for a 5-minute chart, group those 1-minute candles into 5-minute buckets using Pandas:
import pandas as pd

# Load your local minute-level Parquet file
df = pd.read_parquet("timeseries_data/EURUSD_minute.parquet").set_index("date")

# Resample 1-minute data into 5-minute OHLC candles
five_min = df.resample("5min").agg(
    open=("open", "first"),
    high=("high", "max"),
    low=("low", "min"),
    close=("close", "last")
).dropna()
(FX timeseries data is typically OHLC only — there's no real traded volume to aggregate the way there is for equities or crypto. If your provider does return a volume or tick-count field, add it to the .agg(...) call the same way, using sum.)
This aggregates thousands of 1-minute records down into clean 5-minute candles:
minute rows: 4072 -> 5-min rows: 815
Flexible Timeframes on Demand
To build a 15-minute, 30-minute, or 4-hour chart, simply swap "5min" for "15min", "30min", or "4h" using the corresponding base file (minute for intraday, hourly for multi-hour charts).
This approach gives your platform unlimited chart timeframes with zero additional API requests and zero extra storage overhead.
Step 5: Putting it all together — Get the cache running
Now that you understand how the caching architecture, fallback logic, and pre-loading work, let's spin up the entire service locally.
Clone the repository to your machine:
git clone https://github.com/tradermade/tradermade-redis-cache.git
cd tradermade-redis-cache
cp .env.example .env
Open .env and set your API key in TRADERMADE_API_KEY. Then, start the Redis container and launch the Go service:
docker compose up -d
go run ./cmd/server
Once running, your terminal will confirm the setup:
[tm-cache] connected to Redis at localhost:6380
[tm-cache] listening on :8080  (GET /timeseries)
(Note: If go run throws an error saying it cannot reach Redis, the container is still spinning up. Wait a few seconds and run the command again).
Leave the service running in your terminal—it is now ready to handle incoming requests, manage memory caching with Redis, write historical fallbacks to Parquet, and serve your platform in milliseconds.
Note: This works for any API provider. Once you load your timeseries data into a Pandas DataFrame formatted with open, high, low, and close columns, the resampling process is completely identical regardless of which API you use.
Measure the actual speedup
Seeing instant responses in your terminal is great, but putting concrete numbers to it really shows the difference. There are two separate things worth measuring here, and it's worth not conflating them: how much faster the running service is on a cache HIT versus a MISS, and, separately, why a local Parquet read is inherently so much faster than a network call in the first place.
Time the actual service: MISS vs. HIT
This is the number that matters most, since it's what the cache you just stood up is actually doing. Use curl's built-in timing instead of a script, against the service from Step 1 — first against a date range you haven't requested yet (a MISS), then the exact same request again (a HIT served from Redis):
curl -o /dev/null -s -w "MISS: %{time_total}s\n" \
  "http://localhost:8080/timeseries?currency=EURUSD&start_date=2022-06-01&end_date=2022-06-30&interval=daily"

curl -o /dev/null -s -w "HIT:  %{time_total}s\n" \
  "http://localhost:8080/timeseries?currency=EURUSD&start_date=2022-06-01&end_date=2022-06-30&interval=daily"
MISS: 0.214s
HIT:  0.003s
That's the real before/after for your caching layer specifically — the MISS number will vary with your provider's response time and network, but the HIT number should stay in single-digit milliseconds regardless, because it never leaves local memory.
Why Parquet itself is fast
Separately, it's useful to understand why the Parquet fallback layer performs the way it does, independent of the Go service. We can run a simple benchmark script (bench.py) to compare a raw API call against a local Parquet read directly. The script fetches a full year of daily EURUSD data straight from the API, saves a local copy as a Parquet file, and then reads the dataset five times from each source to calculate the median speeds:
# bench.py — set KEY to your TraderMade key
import time, statistics, requests, pandas as pd

KEY = "YOUR_KEY"
URL = "https://marketdata.tradermade.com/api/v1/timeseries"
params = dict(currency="EURUSD", start_date="2023-01-01", end_date="2023-12-31",
              interval="daily", api_key=KEY)

pd.DataFrame(requests.get(URL, params=params).json()["quotes"]).to_parquet("bench.parquet", index=False)

def median_ms(fn, n=5):
    xs = []
    for _ in range(n):
        s = time.perf_counter(); fn(); xs.append((time.perf_counter() - s) * 1000)
    return statistics.median(xs)

api = median_ms(lambda: requests.get(URL, params=params).json())
pq  = median_ms(lambda: pd.read_parquet("bench.parquet"))
print(f"API: {api:.0f} ms   Parquet: {pq:.2f} ms   -> {api/pq:.0f}x faster")
Run it in your terminal:
python bench.py
You'll see output like this:
API: 200 ms Parquet: 1.73 ms -> 115x faster
The exact multiplier will vary a lot with your network and the provider's own response time — treat "115x" as illustrative, not a guarantee — but the direction is consistent: even on a fast connection, reading market data directly from a local Parquet file performs orders of magnitude faster than querying the upstream network endpoint.
The reason is simple: an external API call requires an entire network round-trip to a remote server that has to process, format, and package your request, whereas reading a local Parquet file happens straight from your local disk with near-zero latency. This is the mechanism the Parquet fallback layer relies on — it's what you're measuring with the MISS/HIT curl timings above whenever a request is served from disk instead of Redis.
Why it pays off at scale
With ten users on your platform, a caching layer is a nice performance tweak. But with thousands, it is what keeps your platform alive—because your performance cost shifts from per request to per unique date range.
Imagine ten thousand users loading the EURUSD daily chart in the exact same minute. Without a caching layer, that triggers ten thousand identical API network calls and ten thousand spinning loaders. With this layer in place, once the first request has filled Redis and Parquet, the remaining requests for that same range are instantly answered from local memory in under a millisecond, keeping your application servers light and responsive.
One important caveat: that only holds cleanly for the first request per range. If thousands of those requests land concurrently, before the first one has finished populating the cache, a naive implementation will let all of them miss and all of them call the upstream API at once — a classic cache stampede. Guarding against that requires coalescing concurrent requests for the same key so only one in-flight fetch happens per key at a time (in Go, singleflight from golang.org/x/sync is the standard tool for this). Check whether the reference implementation you're running handles this before you rely on the "only one request hits the network" behavior under real concurrent load — and add it if it doesn't.
Quantitative research and backtesting benefit just as much. Running a backtest across 50 trading pairs over 5 years normally burns through thousands of API rate limits on every run. With local Parquet storage, you pay that network cost once. Subsequent runs read compressed data directly off local disk, turning backtests that used to take hours into quick, repeatable scripts.
Even during upstream network blinks, API rate limits, or provider outages, your platform stays reliable. Historical charts and analytical tools keep loading seamlessly from disk while your live data connection catches up.
As your user base grows, most of the added traffic lands on symbols and date ranges you're already caching, so it turns into local cache hits rather than new API calls. Your API consumption tracks the number of distinct (symbol, interval, date-range) combinations your platform actually serves, not raw request volume — so a platform with a long tail of obscure pairs or highly custom ranges will still see API usage grow with that tail, even if per-request cost for the popular charts stays flat.
What you built
You now have a working timeseries caching layer — and a clear enough picture of how it works to harden it for production — that:
- Answers repeated date ranges directly from Redis in under a millisecond using smart TTL rules.
- Uses a Parquet fallback layer on disk, ensuring service restarts or cache wipes never trigger redundant API calls.
- Pre-loads and maintains historical OHLC candles for your primary trading pairs using a lightweight background fetcher.
- Delivers orders of magnitude faster response times for all historical market data requests.
Your frontend charts, backtesters, and market analysis tools can now read straight from this layer—delivering an instant experience for users while keeping your backend efficient.
Next steps
Historical data is half the architecture; live streaming prices are the other half. In the next tutorial, we will build on this foundation by adding a shared WebSocket connection to feed a real-time last-price cache.
If you're a TraderMade client looking to plug this into your application today, head over to the Github repo for tradermade-redis-cache repository. Read through the README—it has everything pre-configured so you can deploy a production-ready market data cache in minutes.