How to Plot Forex Data in HighStock Charts Demo
25 March 2021
In this tutorial, we will show how to plot forex data in Highcharts. Now for those who don't know, Highcharts is a Javascript and HTML5 based library that is paid product for commercial use. However, for testing and non-commercial use, it's free.
Let us tell you first up that Highcharts have extensive examples and documentation and they provide preset data for some of the stocks to help test the examples they provide. However, we didn't come across Forex data examples and some of our users asked us to provide examples showing how to plot our forex API in charts. So here we are.
We would first advise getting our API key from the dashboard or by Joining API for Free. it takes less than a minute.
You can see our example below that already has changes included from the Highcharts JSfiddle code to make it work.
Now before you go into the example we would like to point some of the changes we made to make it work. First, you will need to import the Momentjs library in the HTML part of the code.
<script src="https://cdnjs.cloudflare.com/ajax/libs/moment.js/2.14.1/moment.min.js"></script>
Then we will call our Timeseries API URL as shown below. Also, you will need to replace the api_key shown below with the one you got from signing up.
Highcharts.getJSON('https://marketdata.tradermade.com/api/v1/timeseries?currency=EURUSD&api_key=apikey&start_date=2021-01-01&end_date=2021-03-01&format=split', function (data) {
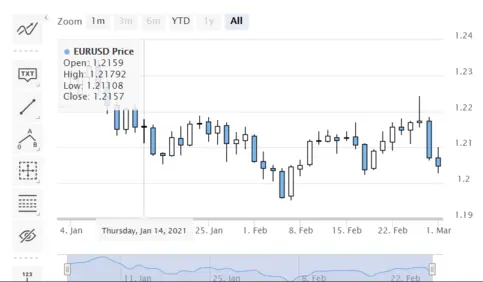
Then you will have to format the date you get from our API as shown below. And that's it you can see the Daily timeseries data plot!
Number(moment(data[i][0]).format('x'))
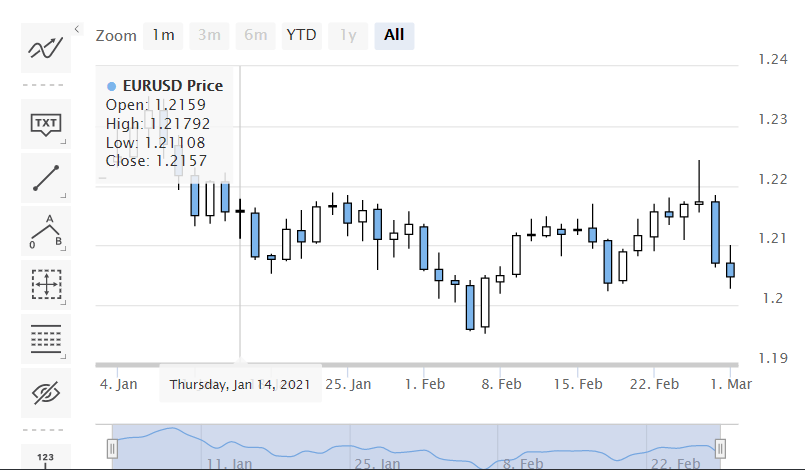
You can see the JSfiddle example that you just need to add the api_key in the URL to see the plot.