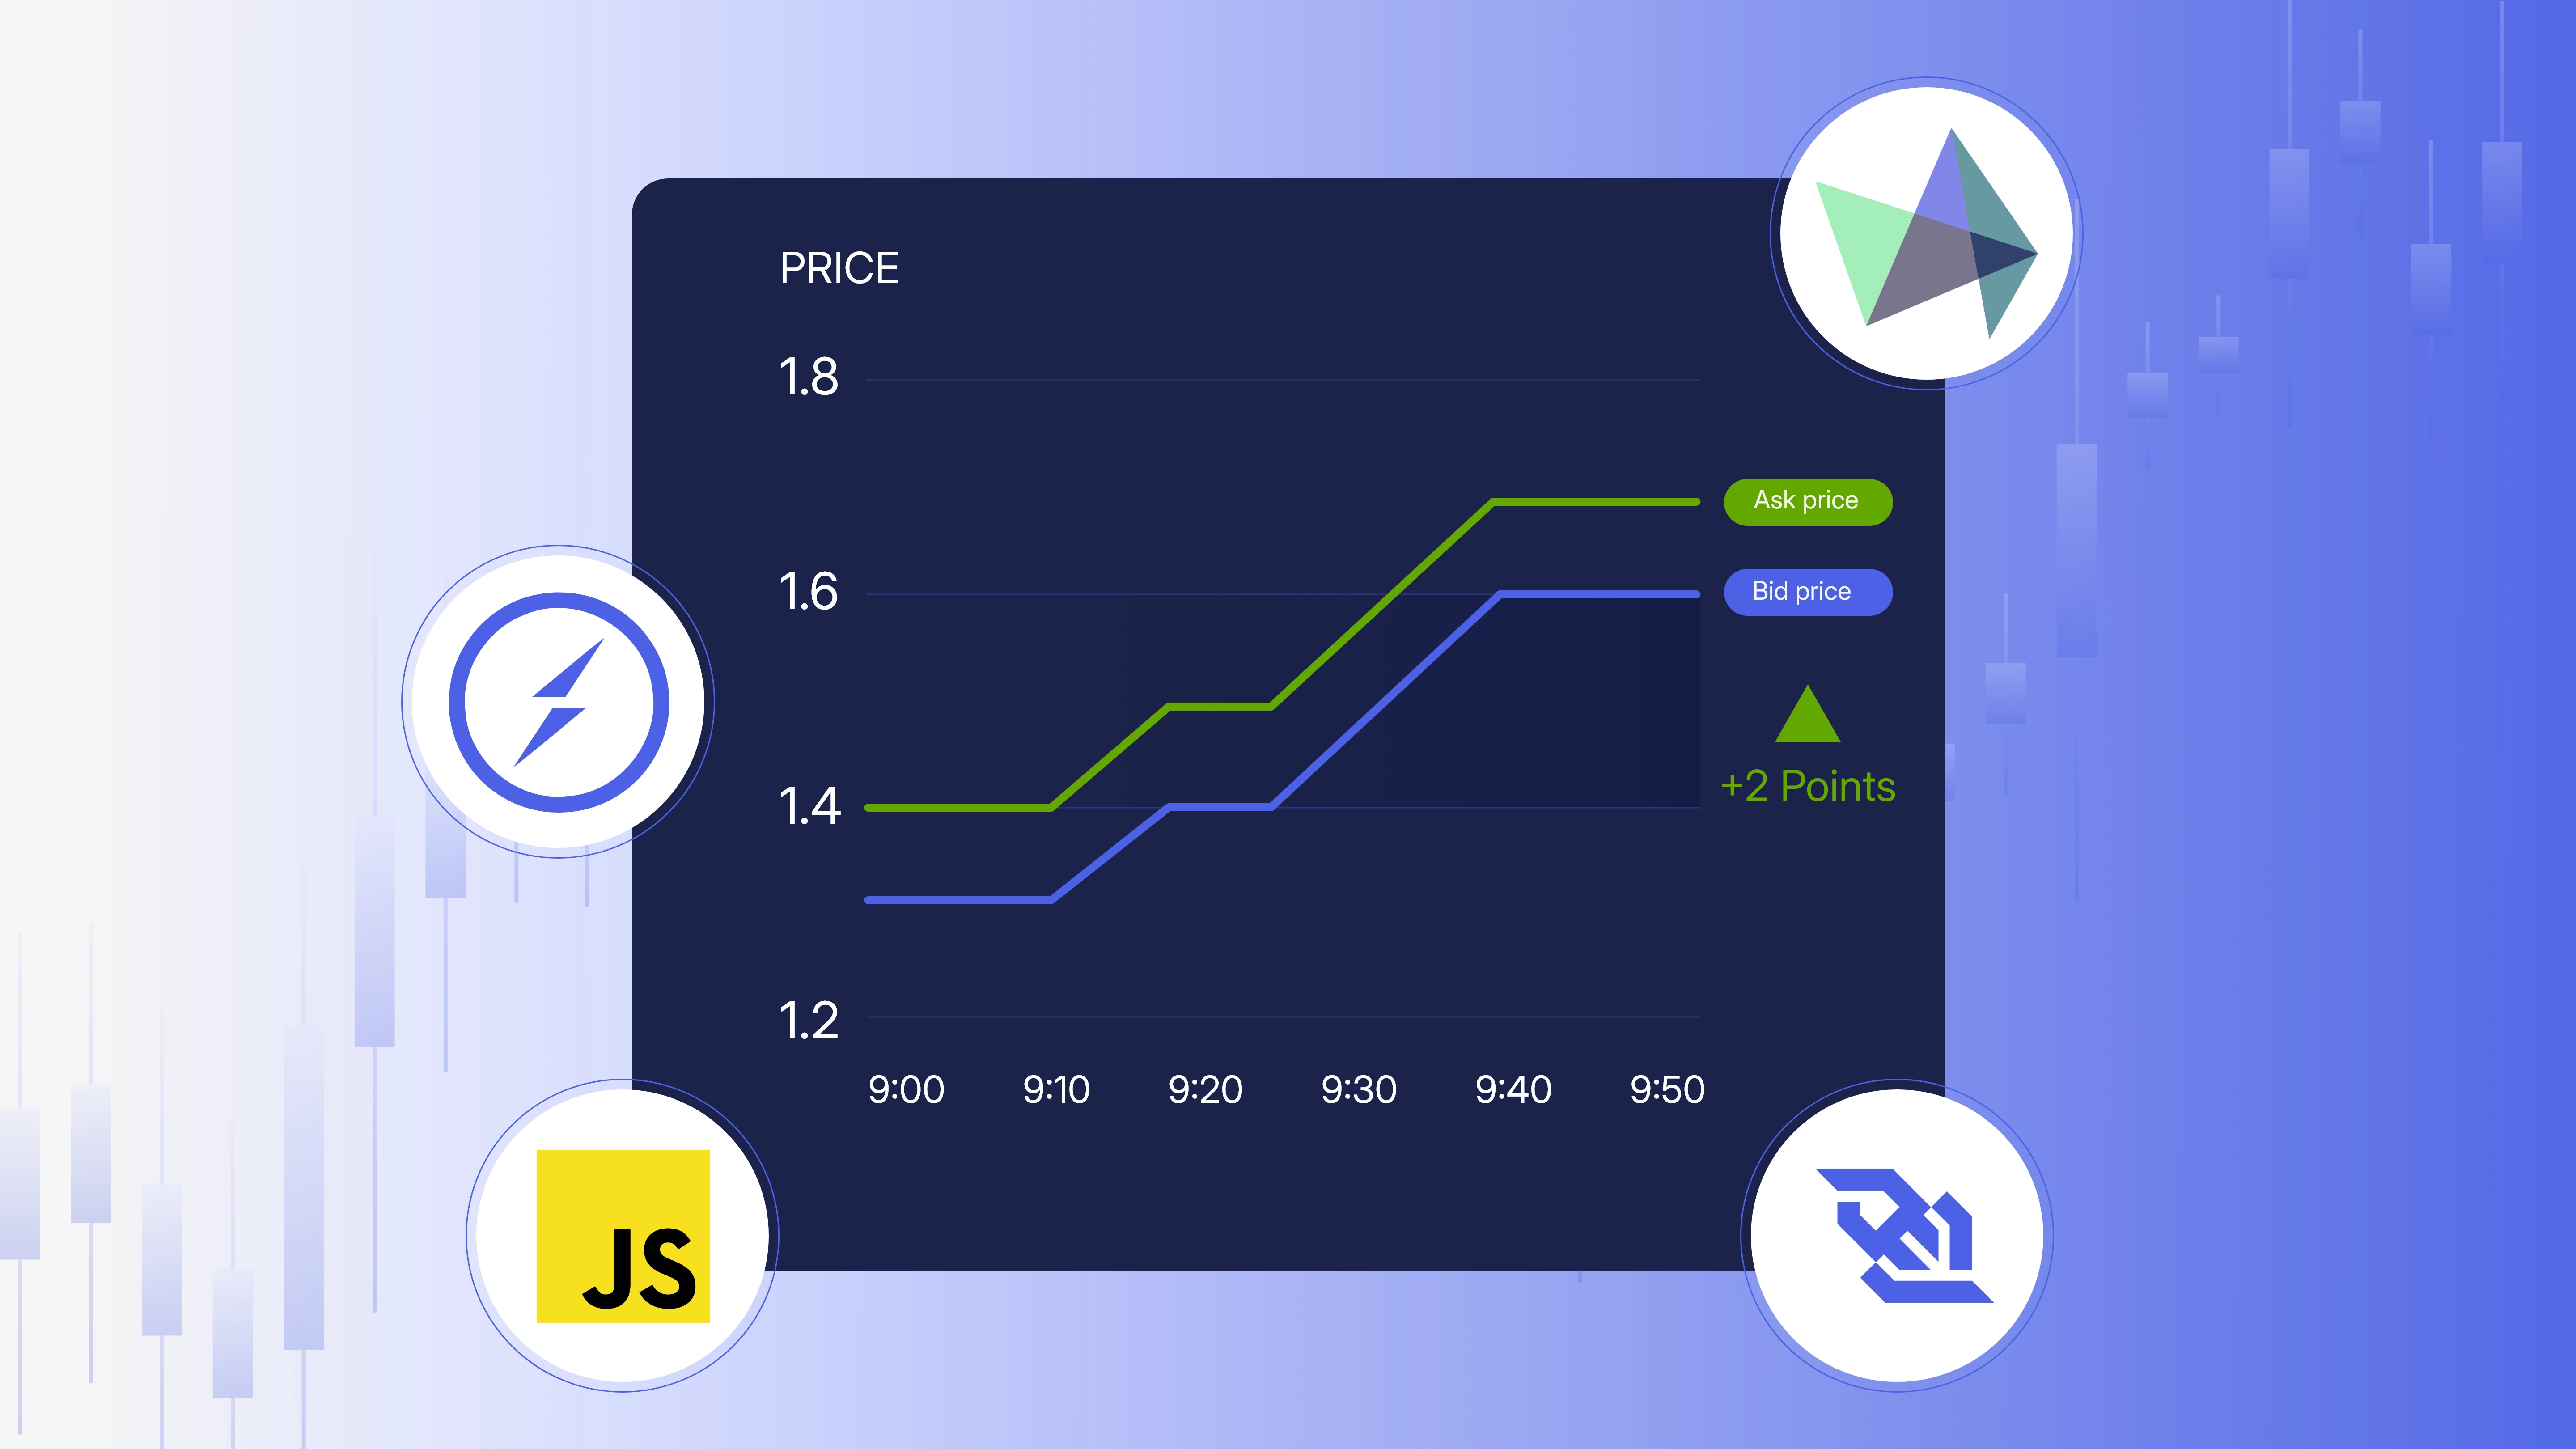
This tutorial walks you through building a live forex web dashboard that:
✅ Displays bid and ask prices
✅ Calculates and tracks spread (in pips and %)
✅ Visualizes either spread or bid/ask prices on a live chart
✅ Uses plain HTML + JavaScript + Highcharts + Socket.IO
🧩 1. Project Structure
project/
├── app.py
├── templates/
│   └── index.html
└── static/
    ├── script.js       ← All JavaScript logic goes here
    └── (style.css)     ← Ignored in this tutorial
📄 2. index.html Overview
You already have the following components:
✅ Head Includes
<script src="https://code.highcharts.com/stock/highstock.js"></script>
<script src="https://code.highcharts.com/modules/exporting.js"></script>
<script src="https://cdnjs.cloudflare.com/ajax/libs/socket.io/4.5.1/socket.io.js"></script>
<script src="static/script.js"></script>
✅ Body Layout
- Buttons: Connect / Disconnect / Theme toggle
- Dropdown: Chart mode selection
- Chart container:
<div id="priceChart"> - Table container:
<tbody id="tableBody">
⚙️ 3. JavaScript Logic in script.js
A. WebSocket Connection
Use Socket.IO to connect and listen for market_update:
let socket = null;

function startConnection() {
  if (socket?.connected) return;
  socket = io();

  socket.on('connect', () => updateConnectionStatus('connected'));
  socket.on('disconnect', () => updateConnectionStatus('disconnected'));

  socket.on('market_update', (data) => {
    updateTable(data);
    if (data.symbol === selectedSymbol) updateChart(data);
  });

  socket.on('initial_data', (data) => {
    for (const symbol in data) updateTable(data[symbol]);
    resetChart();
  });
}

document.getElementById('connectBtn').onclick = startConnection;
document.getElementById('disconnectBtn').onclick = stopConnection;
B. Highcharts Setup: Two Modes
Create Chart:
function createHighchart() {
  const config = {
    chart: { type: 'line' },
    series: [],
    tooltip: { shared: true },
    time: { useUTC: false },
    xAxis: { type: 'datetime' }
  };

  if (selectedChartType === 'spread') {
    config.title = { text: `Spread (pips) – ${selectedSymbol}` };
    config.series.push({ name: 'Spread (pips)', color: '#3a86ff', data: [] });
  } else {
    config.title = { text: `Bid & Ask – ${selectedSymbol}` };
    config.series.push(
      { name: 'Bid', color: '#38b000', data: [] },
      { name: 'Ask', color: '#d90429', data: [] }
    );
  }

  highchart = Highcharts.stockChart('priceChart', config);
}
Reset Chart on Symbol or Type Change:
function resetChart() {
  chartSeriesData.length = 0;
  if (highchart) highchart.destroy();
  createHighchart();
}
C. Update Chart with New Tick Data
function updateChart(data) {
  if (data.symbol !== selectedSymbol || !highchart) return;

  const bid = parseFloat(data.bid);
  const ask = parseFloat(data.ask);
  const spreadPips = ((ask - bid) * pipFactor(bid)).toFixed(2);
  const ts = Number(data.ts) || Date.now();

  if (selectedChartType === 'spread') {
    highchart.series[0].addPoint([ts, parseFloat(spreadPips)], true, false);
  } else {
    highchart.series[0].addPoint([ts, bid], true, false); // Bid
    highchart.series[1].addPoint([ts, ask], true, false); // Ask
  }
}
D. Build the Quote Table
Each update will: - Format bid/ask - Color cells based on direction - Show spread in pips and % - Track high/low spread
function updateTable(data) {
  const rowId = 'row-' + data.symbol;
  let row = document.getElementById(rowId);

  if (!row) {
    row = document.createElement('tr');
    row.id = rowId;
    row.onclick = () => {
      selectedSymbol = data.symbol;
      document.getElementById('chart-title').innerText = selectedSymbol;
      resetChart();
    };
    document.getElementById('tableBody').appendChild(row);
  }

  const bid = parseFloat(data.bid);
  const ask = parseFloat(data.ask);
  const spread = ((ask - bid) * pipFactor(bid)).toFixed(2);
  const spreadPercent = ((ask - bid) / bid * 100).toFixed(4);

  row.innerHTML = `
    <td>${data.symbol}</td>
    <td>${bid.toFixed(5)}</td>
    <td>${ask.toFixed(5)}</td>
    <td>${spread}</td>
    <td>${spreadPercent}%</td>
    <td>–</td>
    <td>–</td>
    <td>${formatTime(data.ts)}</td>
  `;
}
E. Utility Functions
function pipFactor(price) {
  if (price < 5) return 10000;
  if (price < 50) return 1000;
  if (price < 500) return 100;
  if (price < 5000) return 10;
  return 1;
}

function formatTime(ts) {
  let t = Number(ts);
  if (t < 10000000000) t *= 1000;
  const d = new Date(t);
  return d.toLocaleTimeString('en-GB') + '.' + String(d.getMilliseconds()).padStart(3, '0');
}
F. Handle Chart Mode Switching
document.getElementById('chartTypeSelector').addEventListener('change', function () {
  selectedChartType = this.value;
  resetChart();
});
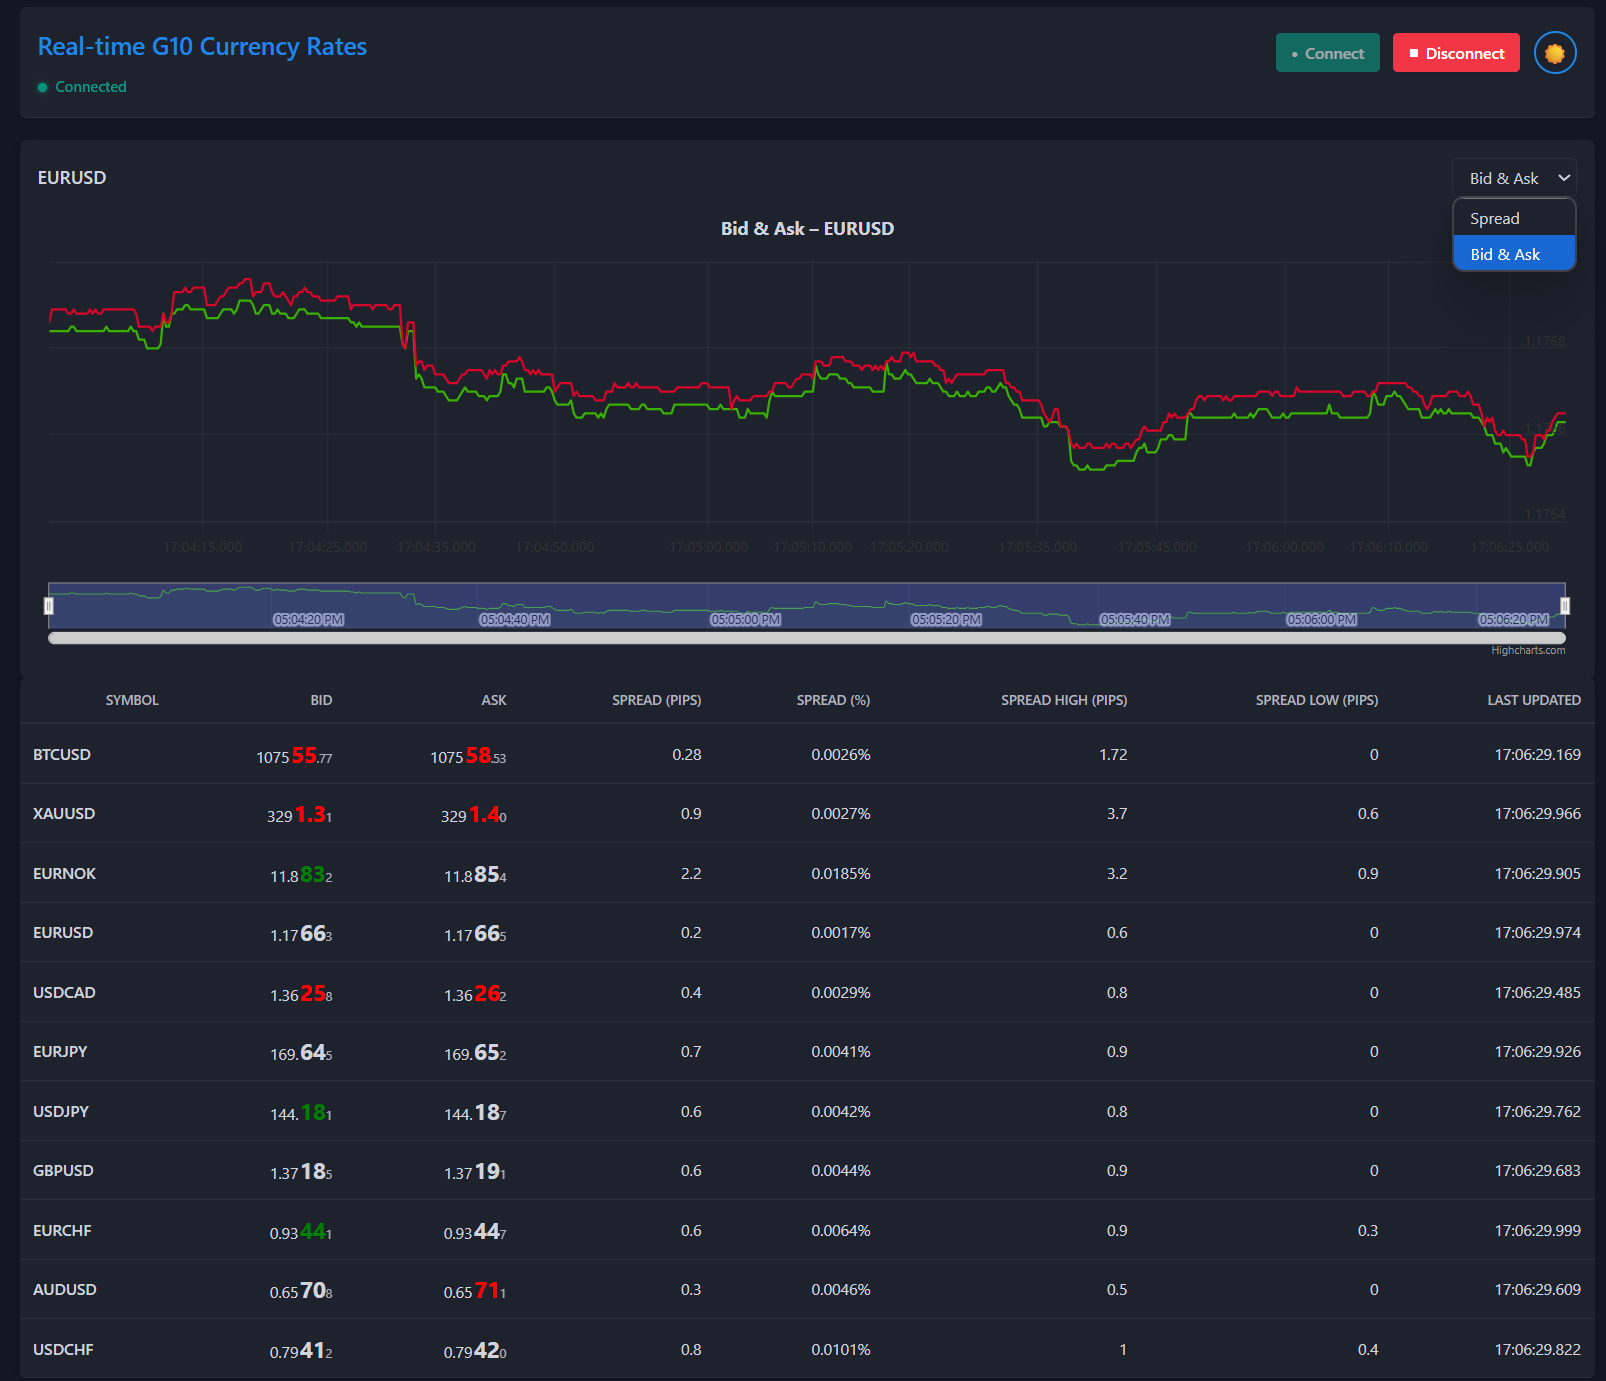
🚀 Final Result
Your dashboard now:
- ✅ Receives live price data
- ✅ Updates an interactive chart in real-time
- ✅ Lets users toggle between Spread or Bid & Ask
- ✅ Displays forex quote rows that auto-update on each tick
- ✅ Has a clean, responsive layout
python app.py
Now open https://localhost:5000 and voila!
Get the full code from Github.