
Market Profile is among the most popular techniques used to analyze the financial markets and we will see how to use it in the forex market. We will not bore you with the details of when it was invented, who invented it, and where. We will dive straight into the basics. But, before we delve into the building blocks of Market Profile, let's understand what it tracks/does.
Market Profile
Market profile tracks intraday trading activity by dividing prices into 30-minute intervals. This helps determine where the price has traded throughout the day and at which time. It is very useful to ascertain fair value areas and gauge market sentiments. It is also indicative of support and resistance area. If this is a bit confusing don't worry, things will become clearer as we explain further.
If you haven't got access to a Market Profile software, do check out the one on our research portal. It's free signup for up to 30 days and can help you practice this tutorial.
Know Your ABC
The market profile is made up of letters with each 30 min interval given a unique letter. These are called TPO (Time Price Opportunities). As the Forex market is open 24hours a day, the letter "A" is assigned to trading activity between 00:00-00:30 hours. After 12:00 the letters are in small caps with 12:00-12:30 given the letter "a".
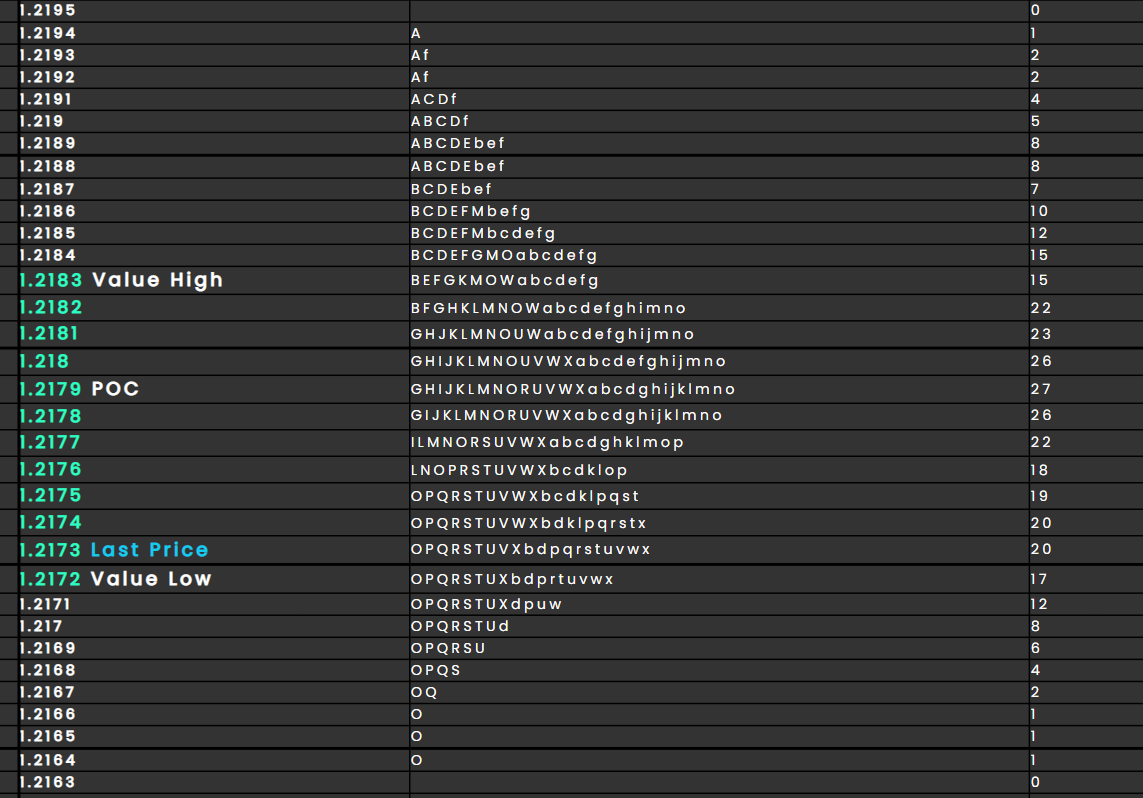
Below is an example of a EURUSD profile, as you can see, letters when seen together create a shape. We will discuss the shapes in a minute, but before that, you can quickly see that trading activity began when the price was at 1.2194 (00:00 GMT) it went all the way down to 1.2164 at the letter "O" (which means by around 07:00 GMT ) and then came all the way back up to 1.2193 at the letter "f" (around 14:30 GMT) and traded most (27 out of 48 30-minute intervals ) around 1.2179.
This shows that the market traded for long hours around level 1.2179 this is called POC or Point of Control and represents a fair value for EURUSD for that day.
POC Is Where Its At
It seems like that is a lot to digest, so let's recap; every price point (basis points) where EURUSD has traded (during the day) is represented on the left. If a price point is observed during a 30-minute interval (say around 12:30 ) we assign a letter to it (in this case b) and as a given price trades more and more during the day more letters accumulate. The price that gets the most letters or TPO's is the POC of the day. In the above case, it's 1.2179.
Ascertain Range
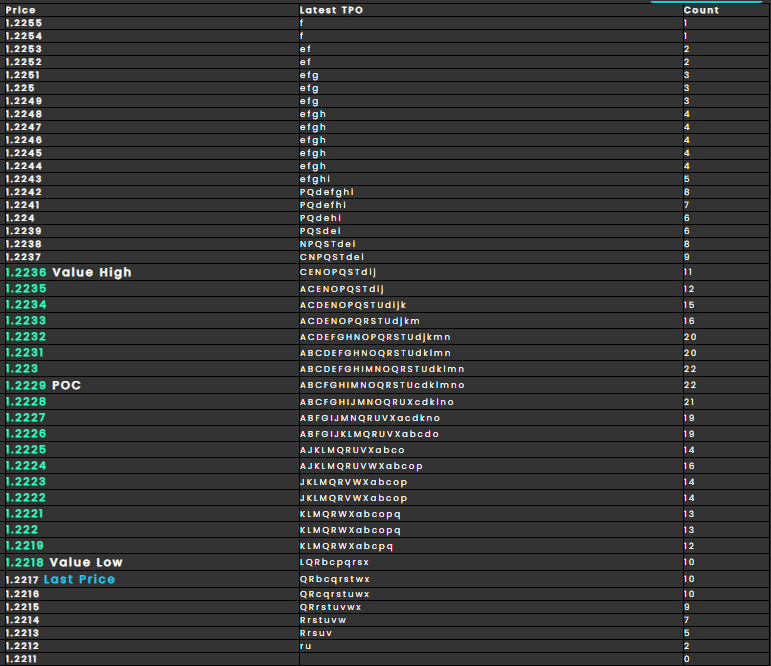
This one is simple to understand, we will not go into the calculation of it as it's readily available on the world wide web. What is not readily available is the explanation of what it means. So the 'range' is the area of a profile between Value High and Value Low as shown above.
The price area between these two levels is the range and it represents 70% of all TPOs. In simple language, it's the price range where the market or traders spent 70% of their time trading during the day.
Shapes are Key
The shapes of the Market Profile sometimes provide further clues into trading behaviour. The most common one is the shape D as seen above that represents the letter D also known as the bell curve. Apart from that, we have P and letter b. Letter b shape is shown below.
We hope this has been helpful, if you have further questions do let us know. We are always open to ideas for tutorials, so do leave us a message on the contact page.