Introduction
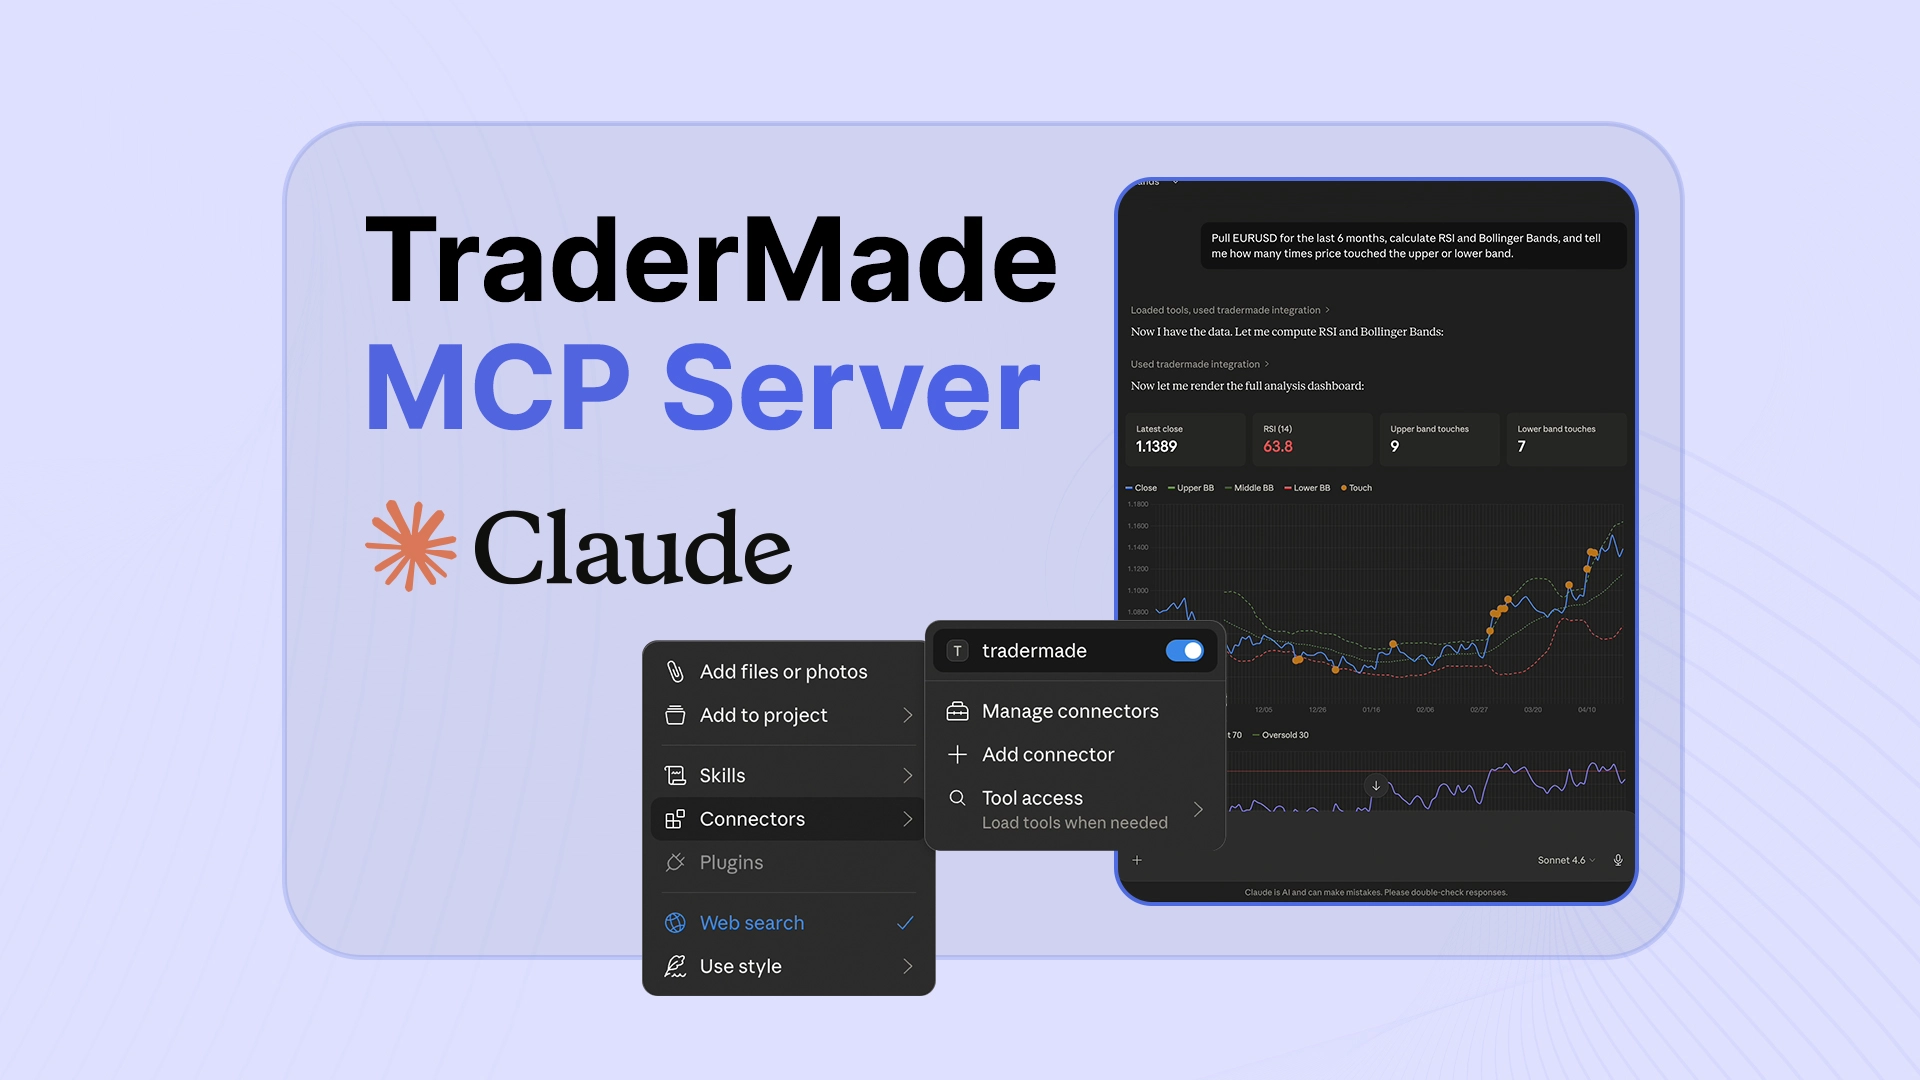
In this tutorial, we are going to use TraderMade's MCP Server to bring live and historical market data directly into Claude. And if you are thinking this needs coding experience, no worries — we have got you covered. With the MCP server, plain English prompts can turn market data into charts, analysis, and trading insights.
We will show how this MCP can help you produce morning market briefs, calculate trade slippage, draw comparative overlay charts, and backtest a strategy using six months of data. By pairing Claude with TraderMade MCP, you can turn tasks that usually take hours into simple conversations that take seconds. Let's get into it.
Prerequisites
- Claude Desktop
- Python 3.10+
- TraderMade API key
Head to our GitHub repo to get started, or check out our implementation blog for the full step-by-step setup guide. We have provided a single line of code—run that, and you can be ready to go in under 2 minutes. GitHub Repo | Implementation Blog
1. Generating a Morning Market Brief
Analysing markets and reporting that took hours now takes minutes. Claude can now instantly fetch data, build charts and provide key levels such as pivots as it has access to accurate data that powers the insitutions: Let's have a look at this example:
Give me a trader's morning briefing for today in investment bank style:
live prices on EURUSD, Gold, Oil, Nasdaq, and Bitcoin, Top Tech Stocks,
with news, overnight moves and key pivot levels for each.
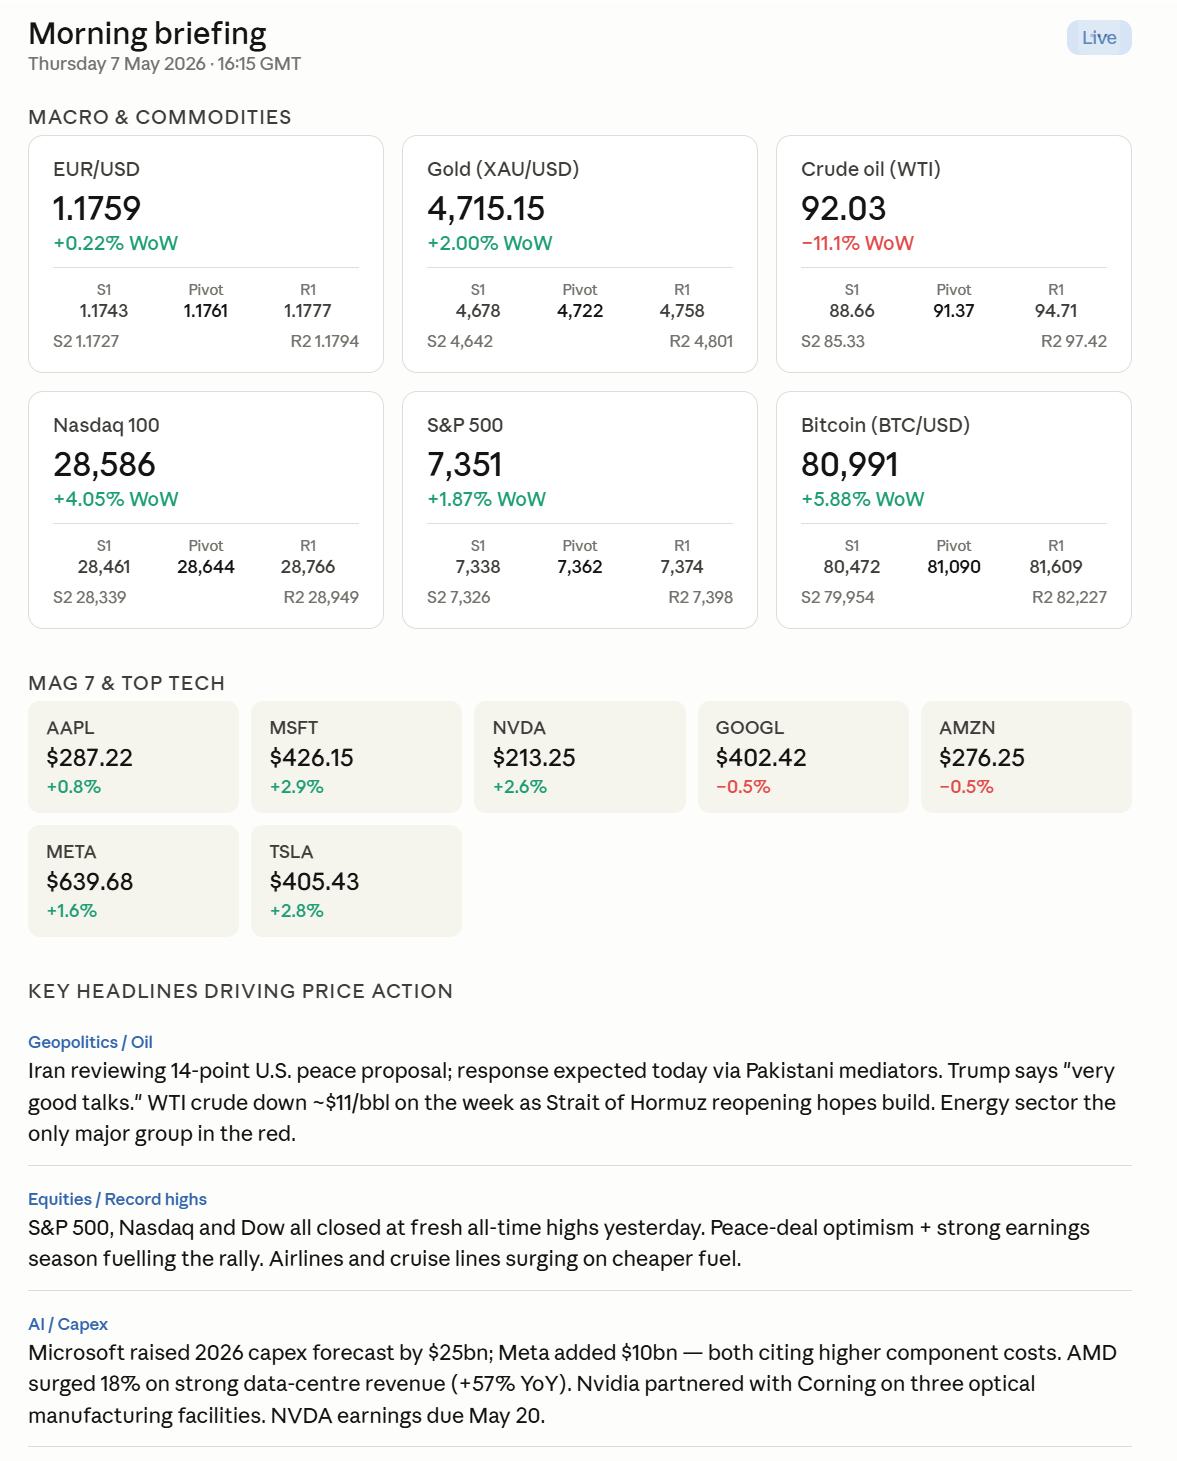
It is that simple, Claude gets the live data directly from TraderMade not free or inaccurate source that it finds and presents you with an actionable briefing. This way, you can entirely skip the unreliable data-gathering process and trust the brief and can share with confidence.
2. Calculating Trade Slippage
Now benchamerking trades or currency conversions have always been time consuming and detailed activity that requires good workflows. Slippage is the invisible tax on your trades and conversions but small teams and traders dont always feel the cost justify the savings. However, advent of AI is changing all that the Tradermade MCP Server helps you determine whether you got a good price at execution or not. Let see, upload your trade file to Claude and prompt:
The CSV file has my trades for this week, including symbol, execution_time, side,
quantity, and execution_price for XAUUSD and EURUSD. Use the benchmark_trade tool
to benchmark my trade. Use the nearest_mid as the benchmark with a 1-minute window.
Summarize my total slippage and flag any trades where the execution price deviated
by more than 3 pips from the benchmark.
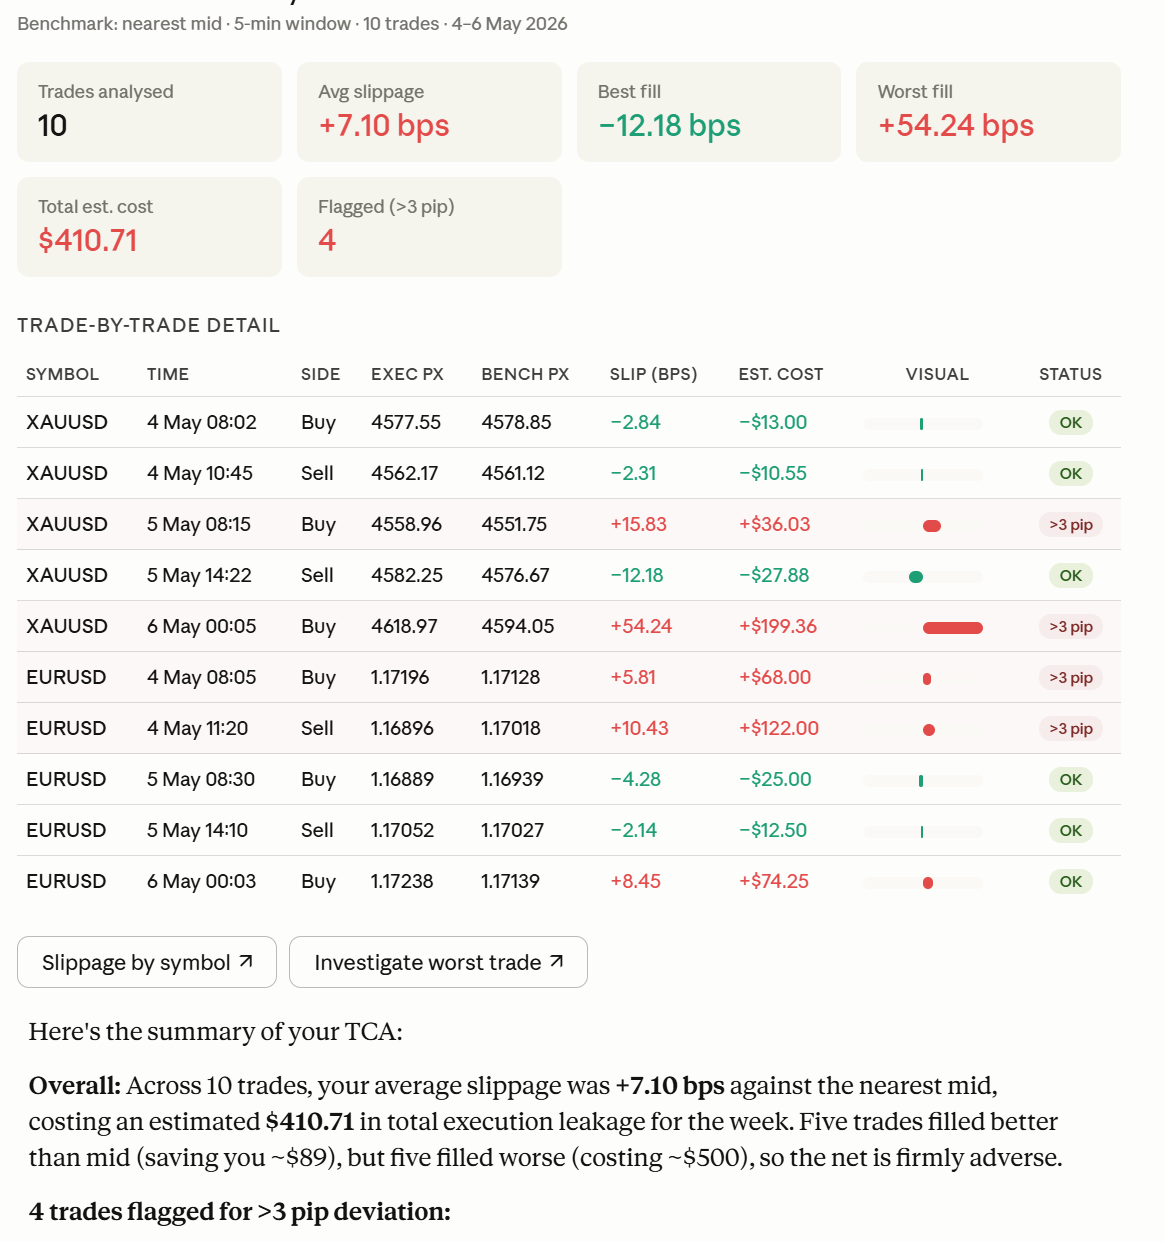
Claude benchmarks every trade against TraderMade's historical data at that exact moment and gives you a clear slippage breakdown by trade. You can also benchmark your trades to the nearest milliseconds. Our historical FX tick data goes back to 2016.
3. Drawing Comparative Overlay Charts
What if you want to share your analysis or charts. Comparing two instruments side by side usually means having a Charting tool or programming knowledge. Here's the same thing in one line:
Fetch daily data for TSLA, AAPL, GOOGL, AMZN and NAS100 for the last 6
months and overlay them on a single normalised chart so I can compare
their relative performance.

Claude pulls both series, normalizes them to the same base, and renders the overlay instantly. You see divergence, correlation, and momentum shifts—all without touching a spreadsheet.
4. Backtesting and Optimization
Backtesting has always dependent on software which requires some prior knowledge or either programming or trading tools, this is changing rapidly. Especially if you have to do quick checks before you run detailed tests. Not anymore with the MCP server, you can simply build your own methodology and customise to your requirements. Let see a simple example.
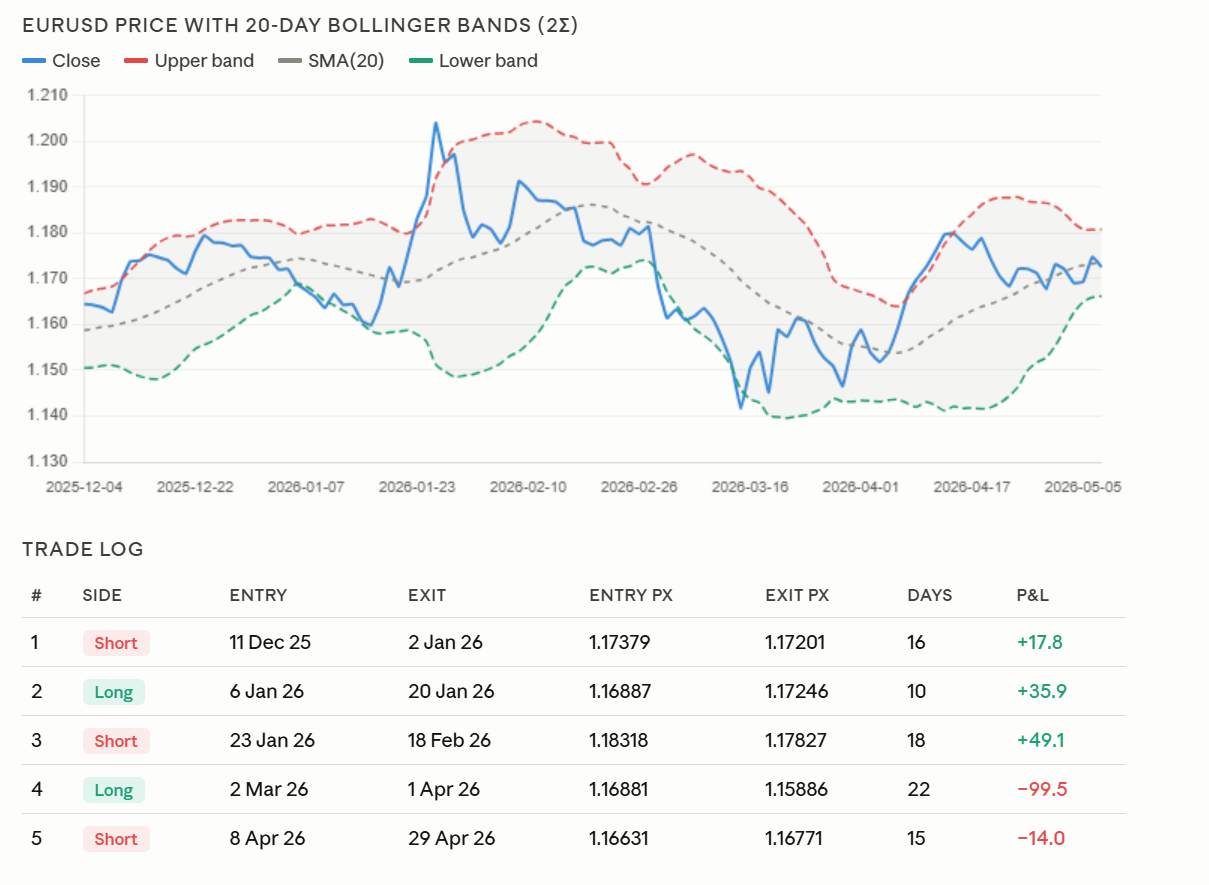
Fetch daily historical data for EURUSD over the last 6 months. Calculate
the 20-day bollinger bands. Backtest a simple strategy that sells EURUSD
whenever price moves above the 20-day Bollinger band and buys when
price moves below the 20-day Bollinger band. Summarize the total return,
win rate, and maximum drawdown.Finally, generate an equity curve chart
showing the strategy's cumulative returns over the 6-month period
so I can visually analyze its overall performance and risk.
Not impressed by the results. Here is the kicker: stop-loss optimization. You can easily refine the backtest with a simple prompt:
Introduce a stop loss of 0.5% and 1%.
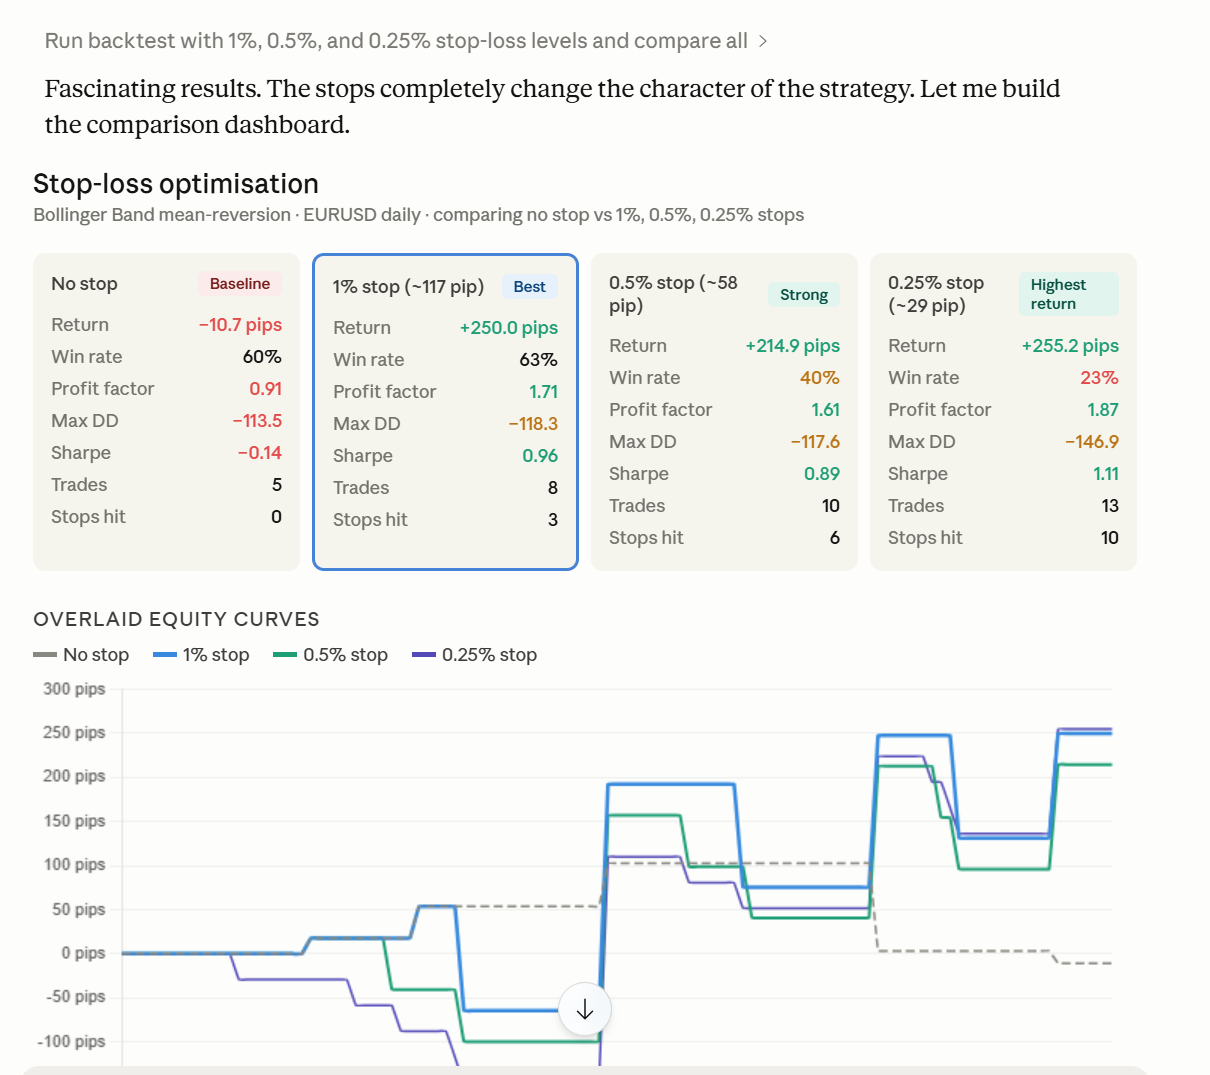
This makes strategy testing much faster and easier to refine. You can adjust assumptions, add risk controls, and compare outcomes without rebuilding the analysis from scratch. By iterating on your strategy this quickly, you can protect your downside and save a significant amount of money in live trading.
Keep tuned in, we will now bring in AI SDKs so any LLM can use our Market data in a single install.
Pricing & Next Steps
Get FX, Crypto, CFDs, live and AI-powered market workflows — Plan starts from £199/month for individual use.
Claude is powerful for analysis. TraderMade MCP makes it market-ready by connecting it to real, actionable FX, Crypto, and CFD data.
For a deeper dive, the full repository and setup instructions are available on GitHub and the TraderMade setup blog.
We'd Love to Hear From You!
Your feedback helps shape the TraderMade MCP Server roadmap. Have a specific market data workflow, tool, or feature you would like to see inside the MCP server? Fill out our contact form or reach out directly at support@tradermade.com — we'd love to hear what would make the MCP server more useful for your trading and analysis needs.