An Introduction to Japanese Candlesticks Course
Looking for live Candlestick Patterns click to view latest patterns
Chapter 1: Introduction
The key to successful trading is knowledge
Trading systems that can generate only profitable trades do not exist. A trader's decisions are often
made
as a result of personal experiences, their feelings, their judgement and their ability to assimilate
the massive flow of information to which they are subjected in the modern trading environment.
(Fundamental data release, news events, and major technical levels etc.).
Technical Analysis is an invaluable decision support tool available to traders. Candle Charts are one
of the
most unique and precise methods of all the known pattern recognition techniques (Understanding
Candlestick Charts should be a must for any trader).
Candlestick charts give a somewhat unique insight into global market sentiment. They give the analyst
the ability to interpret individual segments of price action.
As I have already said, a trading system does not exist that yields only profitable trades, this is
because the system would have to react with extreme flexibility to deal with all the factors driving
market
volatility.
For the time being analysts use tried and tested techniques to forecast future price fluctuations
both for trading and strategic purposes.
Candlestick charting is probably one of the oldest forms of technical analysis (dating back to the mid
16th century)
The Japanese Candlestick is currently enjoying somewhat of a resurgence, as traders begin to discover
the simplicity of this method, which was first used over four centuries ago.
What the Candle Chart will do for you!
It will help you understand timing, trends, and market reversals. Also will help you build discipline in taking profits and setting a stop loss.
The History
By the early 15th century the Shogun Tokugawa managed to pacify the sixty daimyo feudal lords to
create a unified country. This allowed more freedom of trade between the provinces as well as towns such
as
Edo and Osaka. (Osaka was to become the centre of this trading activity). Even today the traditional
greeting in Osaka is "Mokarimakka", which translated means "are you making a profit.
Early records show that charts where first used in Japan in the early 16th Century. This technique was
first used to record the price fluctuations in the rice exchanges of feudaIJapan. Rice was essential to
the
Japanese economy and was used as a unit of exchange as wellas being the primary dietary staple of the
Japanese people.
There were as many as 1300 rice traders working in Osaka at the Dojima Rice exchange. As trade
developed, receipts from rice warehouses were accepted as payment and hence the first futures contracts
were effectively traded.
Sokyu Honma (1716 - 1803) was a brilliant rice merchant who is widely acknowledged as being the
grandf ather of Candlestick Charting.
Honma was such a successful trader that he was eventually elevated to the status of bushi or samurai
which was practically unheard of in his day (merchants were regarded as being very low on the social
ladder). Honma developed a series of rules which were called the "Soba samni no den" or the Sakata
constitution.
The Different Charts To Be Aware Of
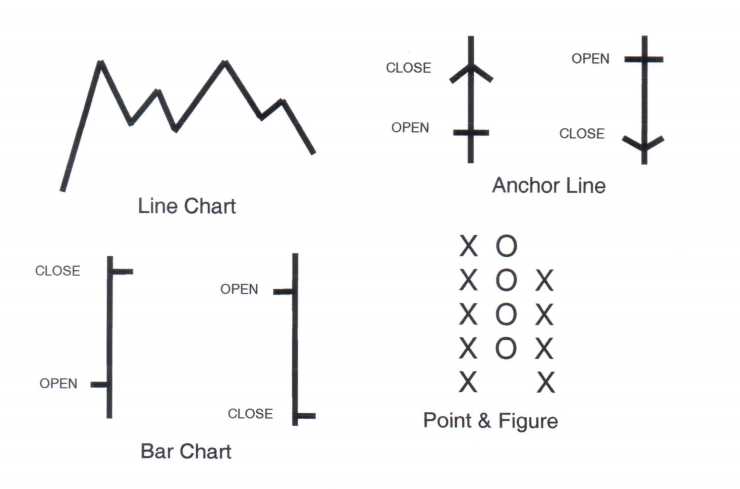
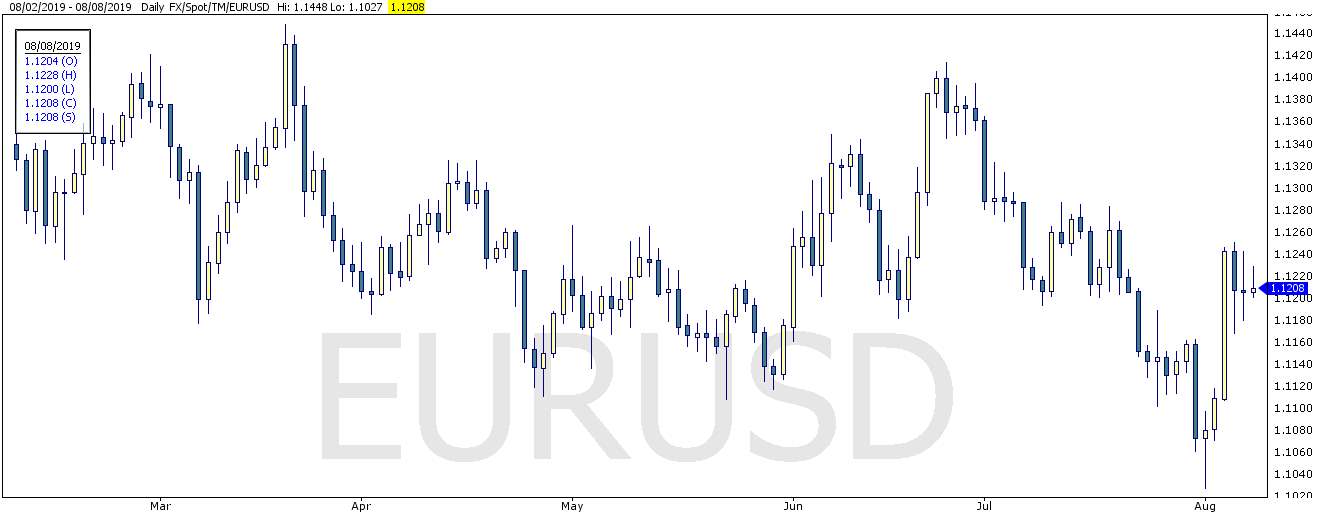
A Candle Stick Chart
What is a Candlestick?
A Candlestick is a graphical
representation of the High,
Low, Open and Close
therefore is identical to the
more common bar chart
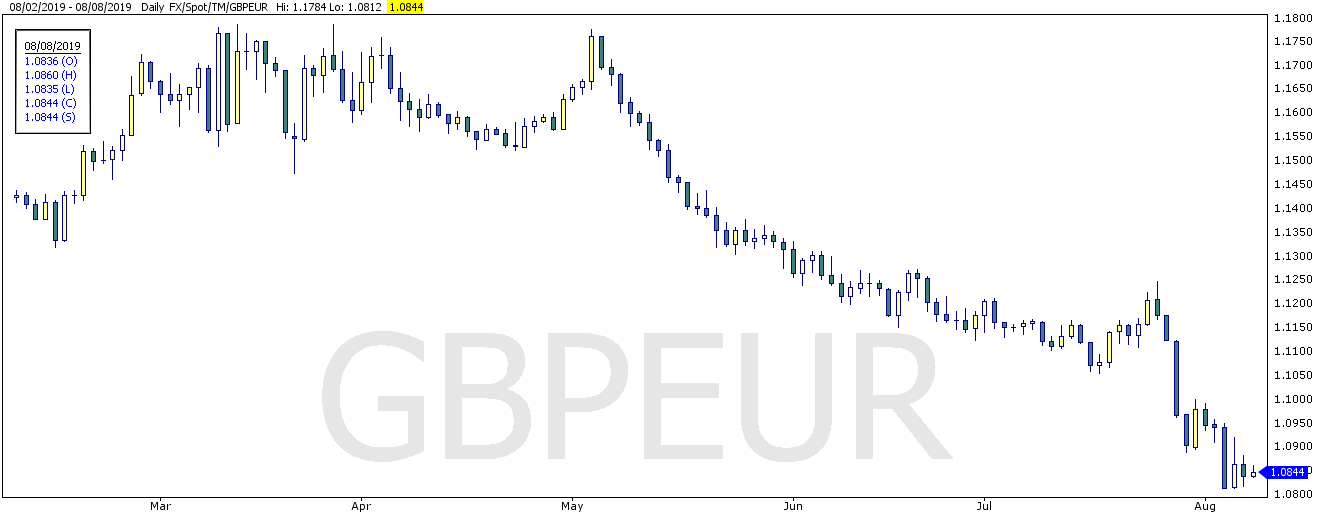
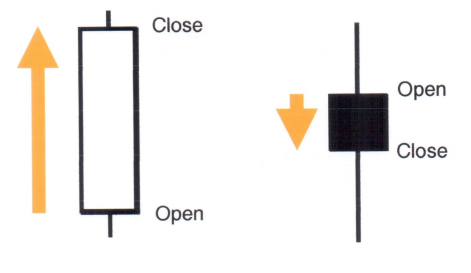
The Candles are colour coded, a light 'candle represents a higher closing relative to the opening of the
particular
session period". A down candle is generally darker, i.e. when the session closes lower than the opening
price for that
period it will become a redo candle.
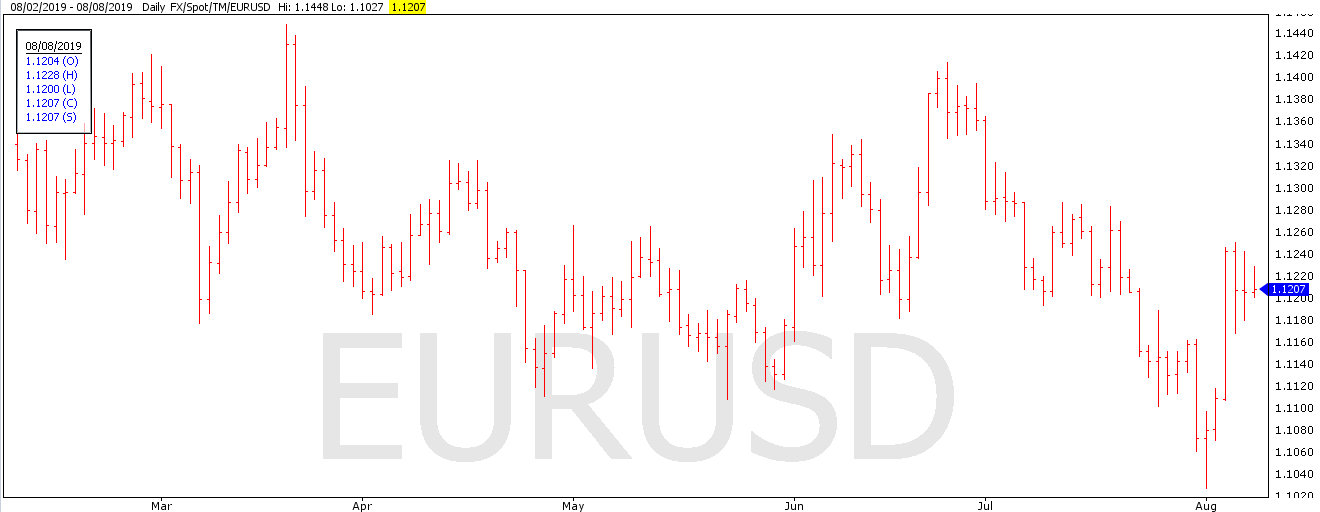
The Candle Chart Vs. Bar Chart
Candlestick Chart
Even though the bar and candle chart are graphical representations of the same inf ormation they
completely different.
Bar Chart
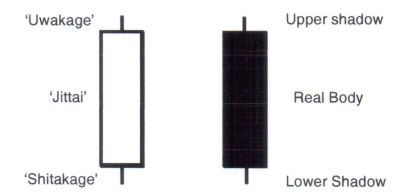
"Jittai" - The Real-Body
The size of the real-body can give us important clues to market sentiment. The Real-Body is the area
between the open and the close of the candle
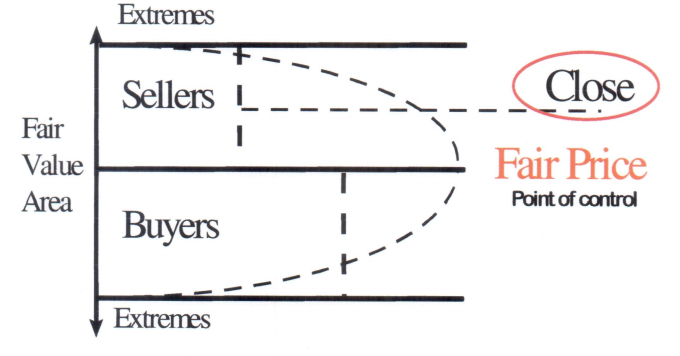
This is the area where most of the trading activity occurred and theref ore it sometimes known as
the true value area. (This is not unlike Steidelmeyer's theory of Market Profile© where it is
important to establish the point of control of the market to determine price equilibrium)
The closing price is the single most important piece of information that you have at your disposal: it is
the
price that will indicate the direction of the next session opening. Most technical indicators will use
the
closing price as a basis for the calculation of buy/sell signals. Important signals willbe generated on this
one
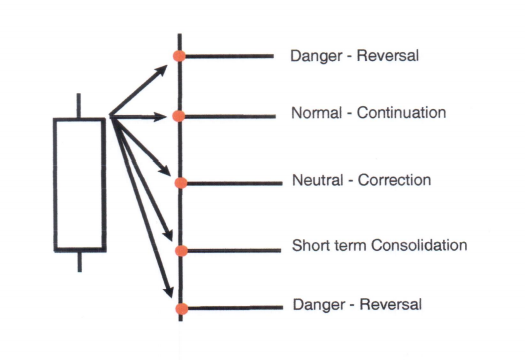
piece of information alone. Corrective and reversal points (see classification)
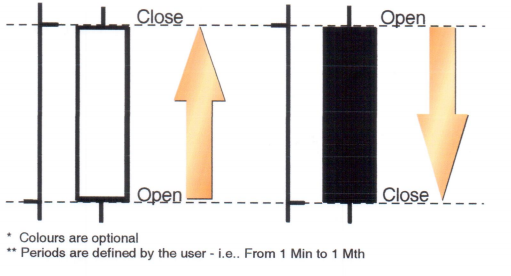
The colour of the real-body can quickly underline the directional changes in any given market over any
given time frame.
The impact of opening versus previous closing.
"Uwakage - Shitakage " Shadows
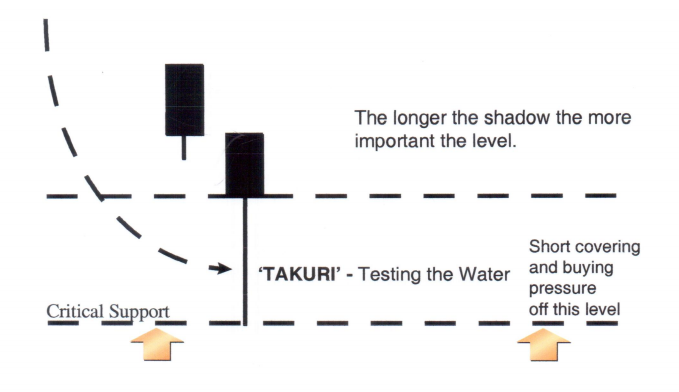
The 50% Level Market Profile
To understand the importance of the 50% level is necessary to understand the concept of Fair Price and
Market Profile e. For any given distribution there will be a level, which is accepted by the market, i.e.
an
equilibrium level called the Fair Price. A close above the Fair Value area is a useful hint.
A nomlalcandle is called a strong line, this simply means that it is a positive continuation of either a
bullish
or bearish move.
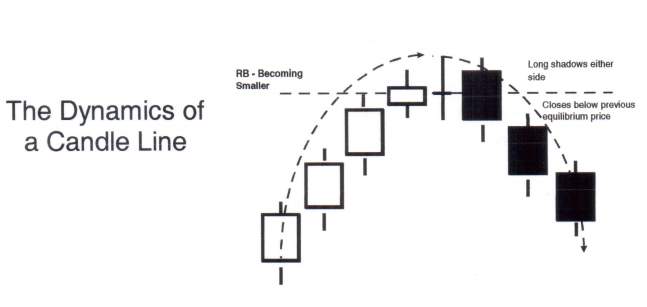
The smaller the real-body the weaker the candle, typically this is when the market consolidates and
uncertainty exists in the market with traders squaring positions and looking for a potential reversal or
corrections
Lengthening shadows herald the existence of weakness in a trend
Significant penetration into the previous line is a potential reversal sign once confirmation has occurred
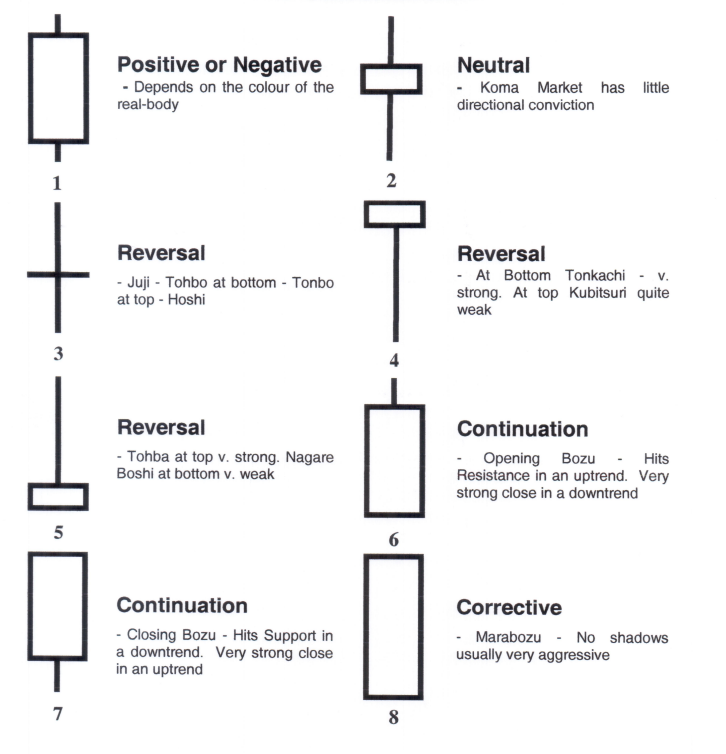
Chapter 2: The Classification
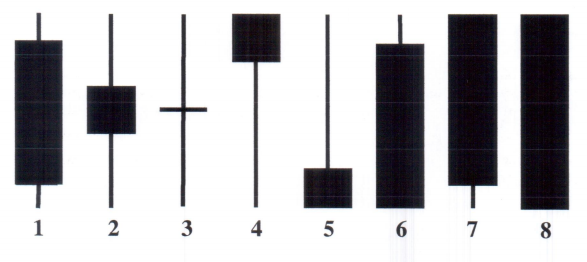
The Original Eight
A New Perspective
A market can only form one of eight candles during each specific time period.
Interpretations may vary in different markets but the basis remains the same.
There are no other possibilities.
Once you understand the eight candles, apply them to the markets you are trading.
"This is the key to the technique"
1. The Standard Line
The standard line is generally considered to be a continuation candle. They are recognised by
the strong real-bodies and smalllower and upper shadows. They will not provide you with any
specific clues in terms of a potentialchange in market direction. They indicate that the market's
directionalconviction is good.

The Standard Candle
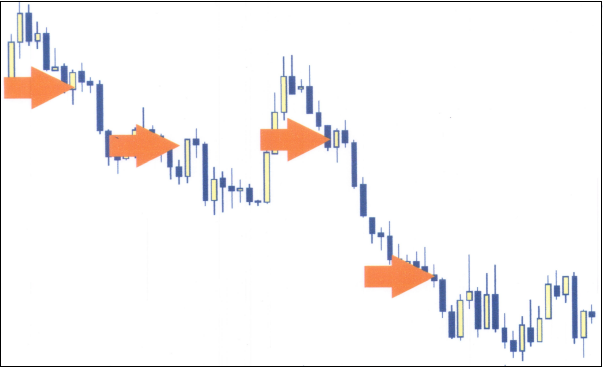
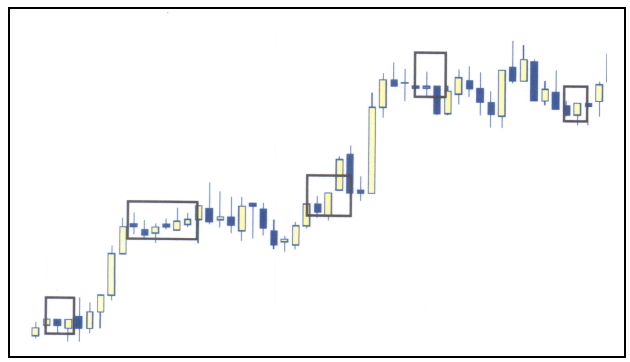
2a The Koma - Spinning Top
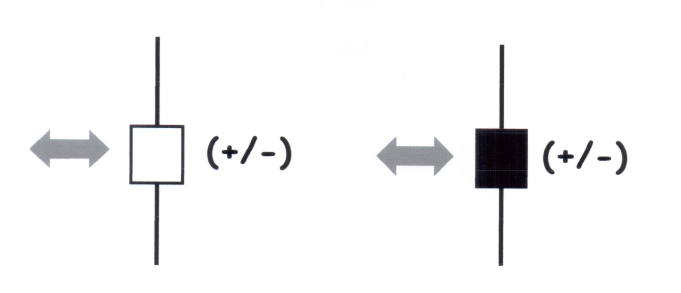
The Spinning Top is a neutral pattern and is distinguishable by its small real-body and long upper and
lower shadows.
Generally the market is considered to be consolidating when this pattern is formed. The market has very
little directional conviction
Koma - Spinning Top
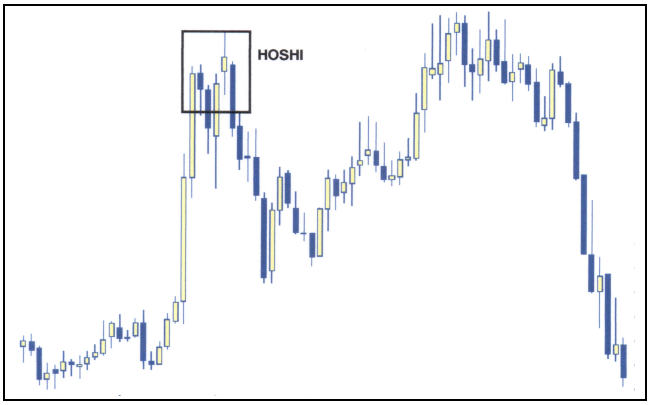
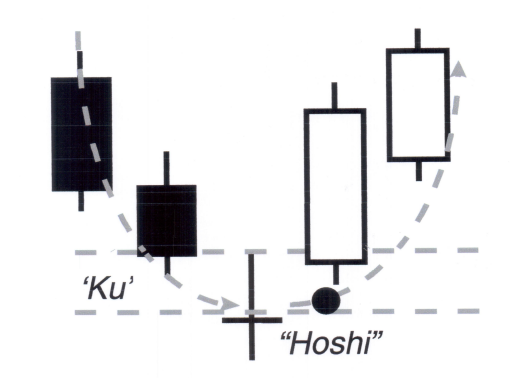
2b The Star - Hoshi
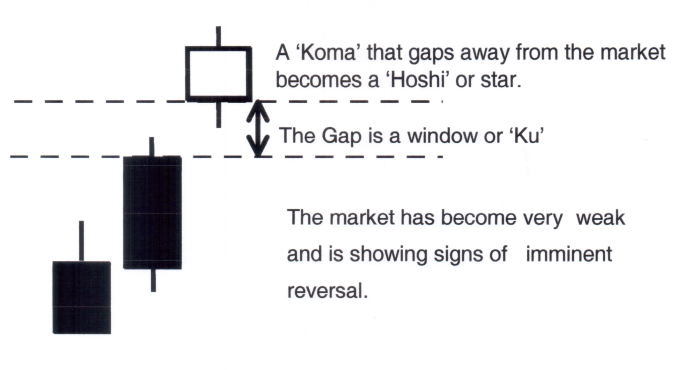
A potential top reversal pattern
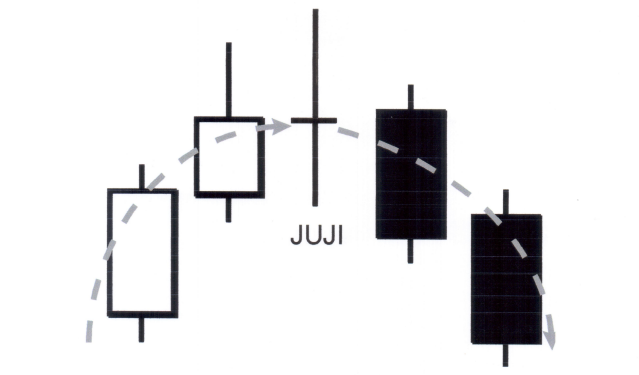
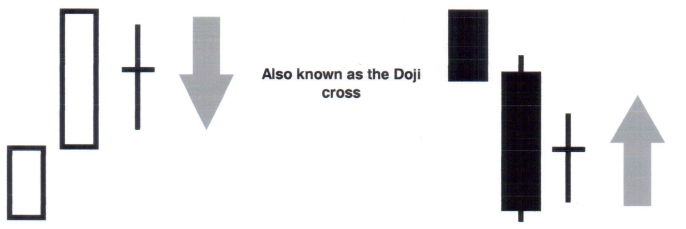
3. The Doji - Reversal
The Doji is very important, it is considered to be a reversal candle. The Dali represents the area where
the Bulls and the Bears meet. (Where the Open and Closing prices are equal, in Japanese Doji means
'the same as'). Originally there were four types of Doji but you will only observe and be affected by the
first three.
A potential top reversal pattern
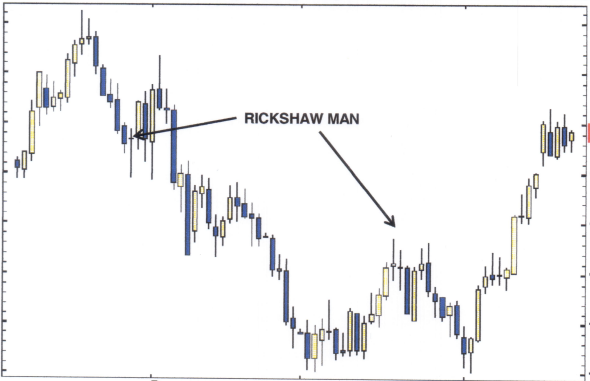
The Long Legged Doji- (also known as the Rickshaw man), shows a potential turning
point where the
upper and lower shadows are long and are of approximately equal length.
Rickshaw Man
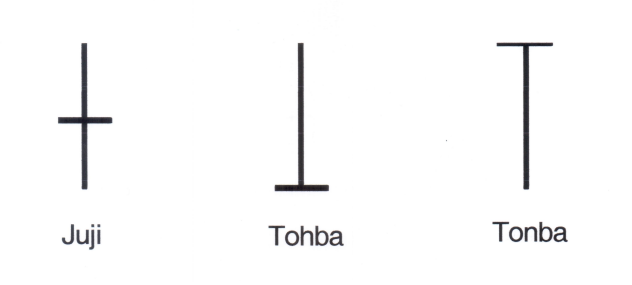
3b. The Gravestone Doll- 'Tohba'
It is called the gravestone because of its shape. The original thinking behind this pattern was that this
was a sign of the end of a bullish attack.
Gravestone Doji
3c. The Dragonfly Dojo- 'Tonbo'
This is the exact opposite of the Gravestone and is found exclusively at a market bottom.
Dragonfly Doji

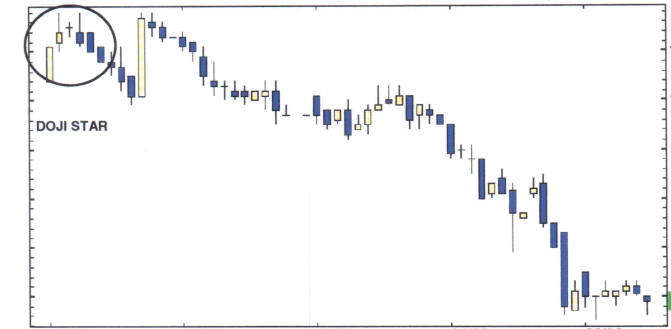
3d The Dojo Star
One of the strongest reversal patterns, found at tops and bottoms. Is known as a pattern of three, though
at this stage the Dojo that gaps away from the previous close is warning enough.
Dojo Star
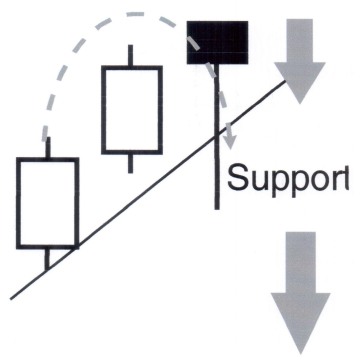
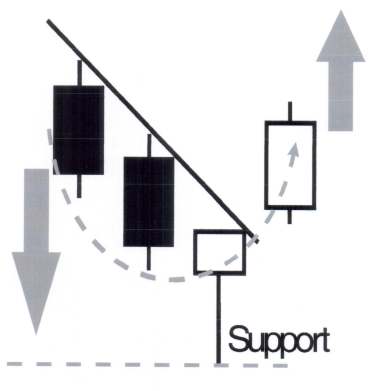
4 The Umbrella - 'Karakasa'
At the top of the market this pattern is called a hanging man, but at the bottom of the market it is
known as
a hammer. There are two distinct variations of the umbrella pattern. The Hanging Man at a market top
and the Hammer at a market bottom. An umbrella should have a small real-body with little or no upper
shadow. The lower shadow should be 2/3 times the length of the real-body. The umbrella is widely
regarded as a reversal line but confirmation of reversal is required. The colour of the real-body is
usually
not considered to be important but would recommend that you do pay attention to the direction of the
closing as this gives additional weight to the pattern.
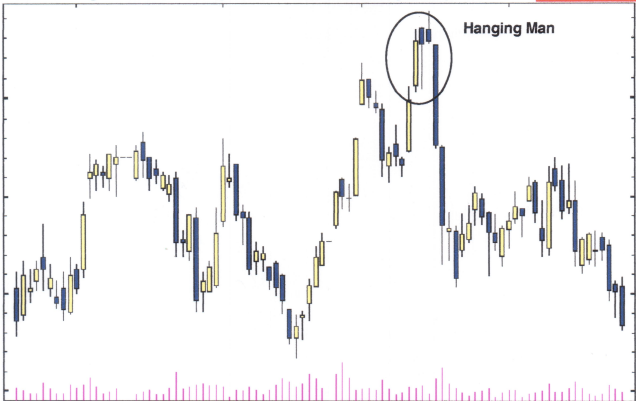
4a Hanging Man
The market has to be in a clearly defined uptrend
The market shows signs of weakness and aggressively tests the downside.
The session however, closes much higher than the recorded low. A close below the support in the next
three periods is required for confirmation if reversal. A break of a trend line could also act as a
valid confirmation.
Hanging Man Exmaple
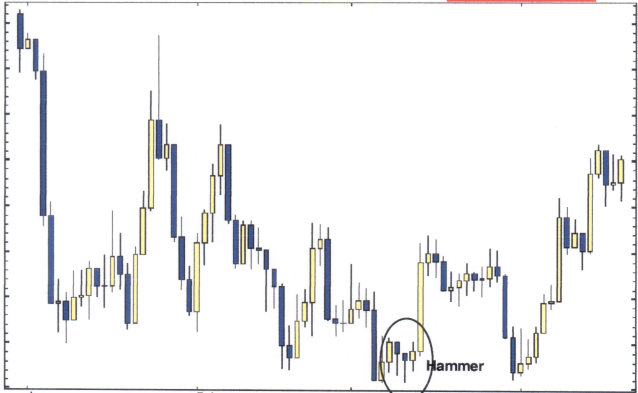
4b The Hammer
The Hammer is a very important
bottom reversal pattern.
The colour of the real-body is less
important than for the Hanging Man as the
market has bounced off a low in a
downtrend.
Strong buying has occurred, and indicates
a good levelof resistance.
The long shadow is indicative of the strong
buying pressure.
Hammer Example
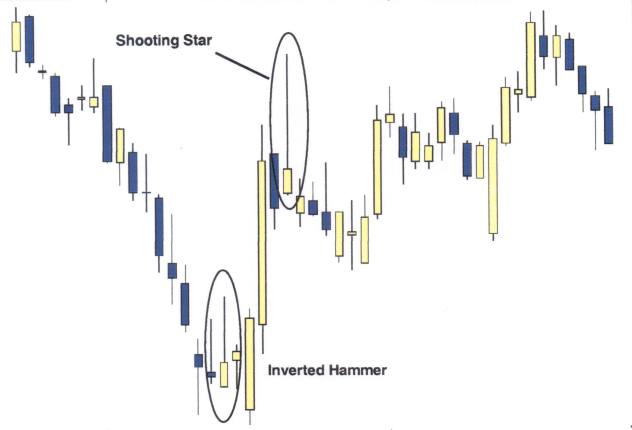
5 Inverted Hammer -Reversal
This pattern is the direct opposite of the umbrella lines or Karakasa. The shooting star can be a
powerful
revenalsignalin an up-trend (but only on a new high). An inverted hammer is indicative of a strong area
of resistance; confirmation is sought prior to entering any new long positions
Inverted Hammer Example
6/7 The Bozu Line
Also known as a Belt Hold Line or Shaven Top or Bottom. These are continuation lines but can show
weakness in a trend.
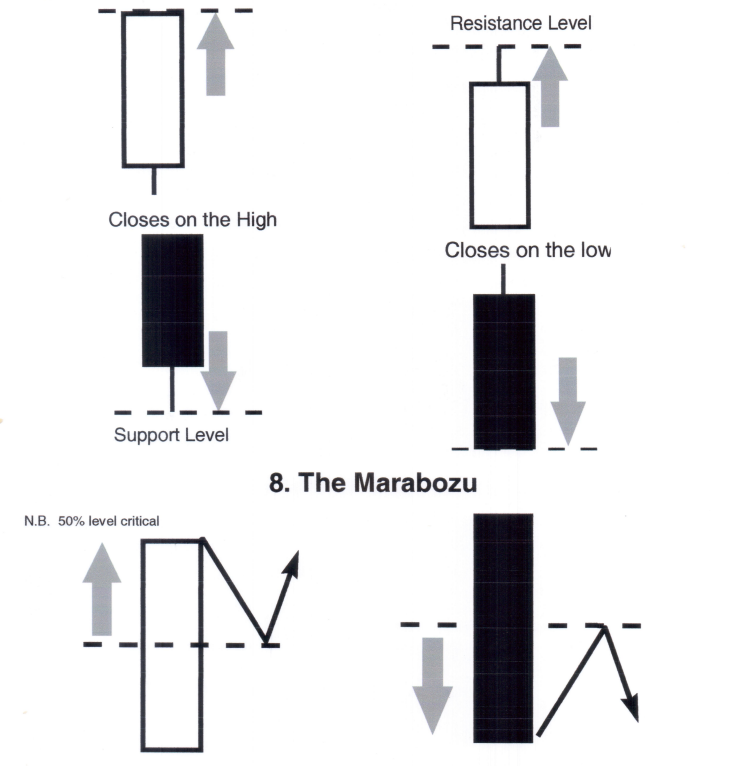
The Marabozu is a Candlestick with no upper and lower shadow. The period opens and closes on the low
and high. The Marabozu is very common in short term charts, especially after the release of economic
data. It is usually corrective to some degree.
The Long Standard Line
The long standard line is easily identifiable as a single candle line. It is 2/3 times the length of a
normal
standard line (it stands out). Like the Marabozu this line generally corrects and it is quite common to
draw
corrective retracements along the length of the move in order to be able to ascertain the ability of the
trend
to continue in its actual direction and to sustain the momentum of the trend. Because of the abnormal
size of the move a correction or consolidation phase will always occur after this particular line.
The Classification
Chapter 3: Reversal Patterns
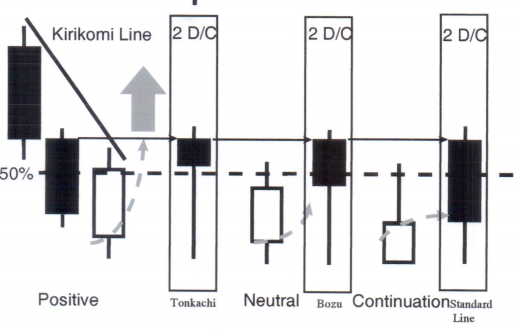
In section I we looked at the individual classification of the various candle lines and have assigned a
nominalvalue to the moves in terms of positive, negative and neutral. In this section we look at the 2-day
(session) reversal patterns. In this section it is essential to understand the impact of the opening verus
the previous session closing value as this is always a good pointer to the state of the market. We also
look at a little known confirmation technique which is derived from combining the open of the first day and
close of the second day, this information is then used to create an artificial candle, and the classification
of
this is used as a confirmation signal. This is done to achieve a greater understanding of changes in
market sentiment.
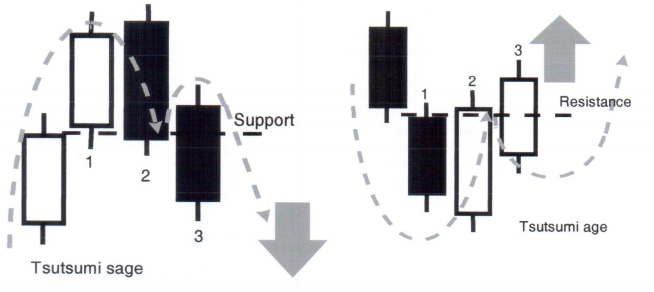
I -The Tsutsumi Line
Bearish Tsutsumi Line
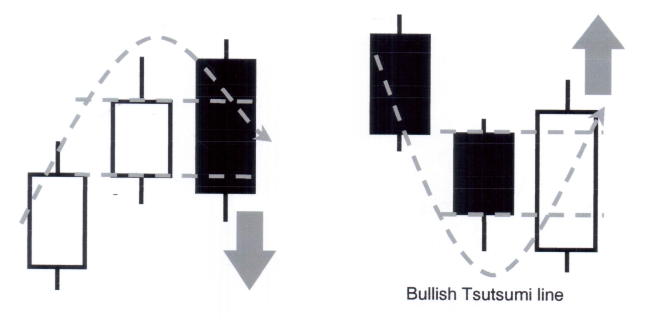
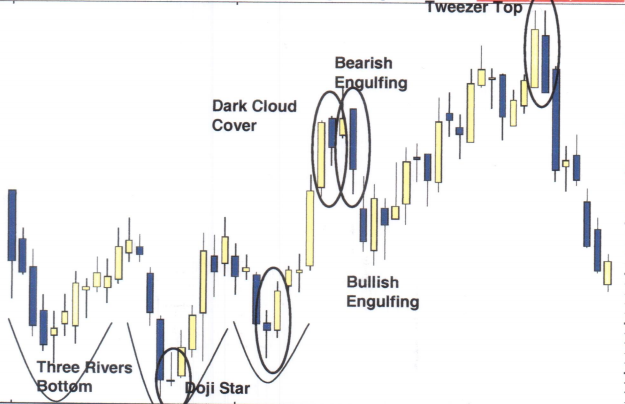
la. The Bearish Engulfing Line
Tsutsumi Line
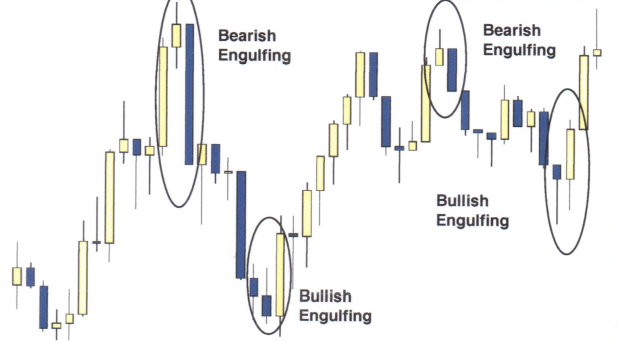
The Engulfing Line is one of the strongest
of all the reversal patterns and is a quick
and effective method of spotting a
change in market sentiment.
The market has to be in a reasonable
trend for this pattem to be validated.
Tsutsumi Line
The next period opens higher than
the previous close, creating a gap or
'Ku ', (in section 1 we have seen that
this phenomenon is usually a sign of
market weakness).
The real-bodies are obviously of opposite colours.
Tsutsumi Line
The close of the current candle line is lower than the previous session open - engulfing the whole of
the last real body.
The shadows are not taken into consideration at this stage.
Tsutsumi Line
The open of the first day and close of the second day would result in the entire session resembling a
Tohba or Shooting Star.
This technique gives additional understanding to the analyst and suggests that this pattem does not
require confirmation.
1b The Bullish Engulfing Line
This is the reverse of the bearish engulfing pattem and is very strong with the 2DC forming a
hammer
There must be a reasonable trend in place for this pattern to work.
Trading Strategy is to square trades that are positioned with the prevailing trend and get ready to
reverse if second day f ollows through - (Confirmation is not necessarily required if all the rules
have been adhered to).
(2 Day Candle - Classification = Tonkachi Positive)
Bullish & Bearish Engulfing
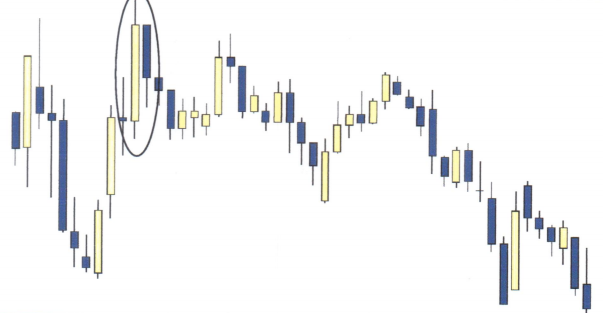
2 -The Kabuse Line
Very similar to the Engulfing pattem but does not engulf the whole of the previous 'Jittai '.
A sustained up-trend is required, with price action of the active session opening higher than the
close of the last session and in turn closing well into the previous real-body
The greater the penetration into the previous period the stronger the signal.
Trading Strategy - Close long positions; go short when trend reversal confirmed.
This line is a reversal but is weaker than the engulfing pattem therefore a close below point (a)
would act as a confirmation
2 Day line - Classification
Star = Negative
Kabuse Line Example
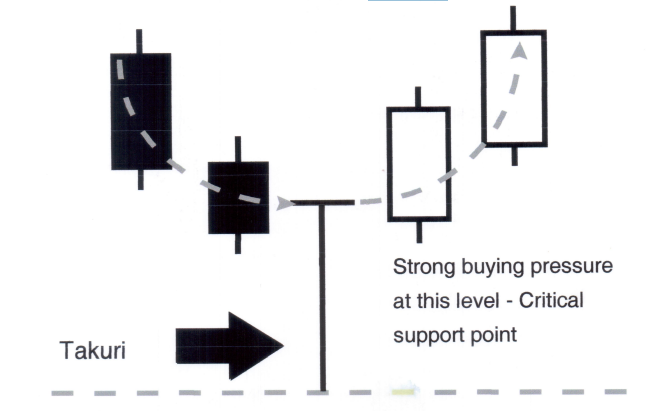
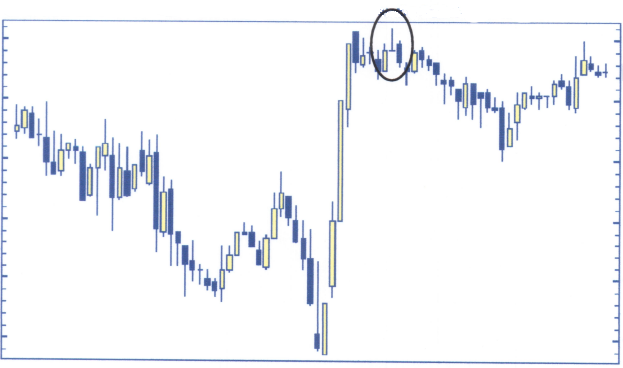
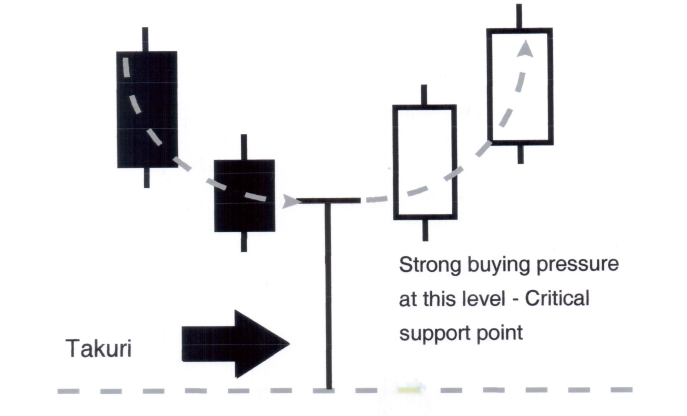
3a Deaisen - Counter Attack Lines
Deaisen is a meeting line - in effect two periods of price action converge, to form a reversal
pattern known as the Piecing Line
Sashikomi is when a big gap occurs between the close and the opening of 2 sessions with price action
retuming to close on the higt] meeting the old price action.
The 2 d/c Shows the long'cTakuri dnd suggests that price action has touched a key support but
confirmation is required prior to reversing a position i.e. a new high in the next trading
session.
Deaisen - Counter Attack Lines Example
3b Deaisen - Meeting Lines
The Bearish meeting line is found at the top of a trending market.
Price action initially gaps away from the previous close, but closes into the real-body of the
previous session.
Deaisen - Meeting Lines
4 The Piercing Pattern
Again similar to the Engulfing pattern but does not engulf the whole of the previous 'Jittai '.
An important feature of this pattern is that you must get significant penetration into the previous real-body
to walla reversal.
The greater the penetration into the previous 50% period the stronger the signal.
Trading Strategy - Close long positionslgo short when trend reversal confimled.

The importance of a close. well into the previous real body is highlighted by the 2 d/c
5 Atekubi & Irrikubi Lines
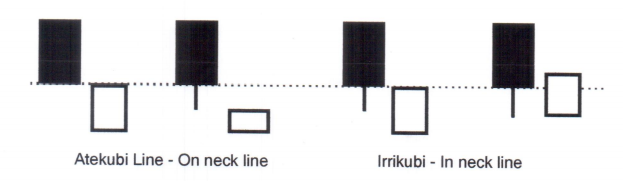
These patterns are variations of the piecing line. They are by nature weaker. The Atekubi is the weaker
of the two patterns, and is generally found after erratic market moves. Sellers provide strong resistance.
The Irikomi line is usually interpreted as a temporary recovery.
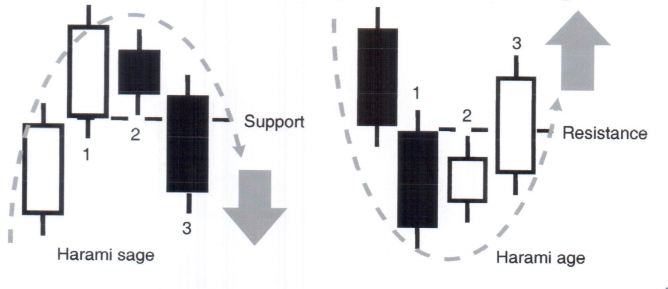
6 The Harami Line

6a The Bearish Harami Line
The Haramiline is also known as an inside day This is because the price action is contained within
the previous period's real-body.
A market must be trending before it can be considered to be a reversal.
The market opens lower than the previous close and becomes corrective as opposed to a reversal
signal.
Very often second line is a 'Koma' or spinning top
6a The Bullish Harami Line
The Harami line does nQ!.m.ake.q new.Hgh so needs tQ be confirmed in the next session if you think
that it'ii= heralding a change in market sentiment.
Trading Strategy - Exercise extreme caution when you see one of these patterns, raise your stop-loss
level if risk to reward ratio is good enough. If expecting a full trend reversal it is imperative to
seek confirmation prior to acting. (This could be a subsequent u/d move).
6c. The Harami Cross
Harami Yose Sen
Because the last candle is a Doji this pattem is much more significant than the standard Haramiline.
Shadows are excluded (except in the case of Tweezer which will be covered shortly).
Trading Strategy - Close current positions and look for an opportunity to stop and reverse where possible
Harami Cross Example
7 The Doji Star
Doji bike
Doji Star Example
8 The Separating Line
lki Chigai sen
The separating line is a powerful pattern and very rare.
The basis for this line starts in a trend. When (as in the example) the market is in
a trend and closes lower as expected. The
next opening creates a huge counter trend
gap and price action closes higher on the
aay
Separating Line Example
Separating Line Vs Meeting Line
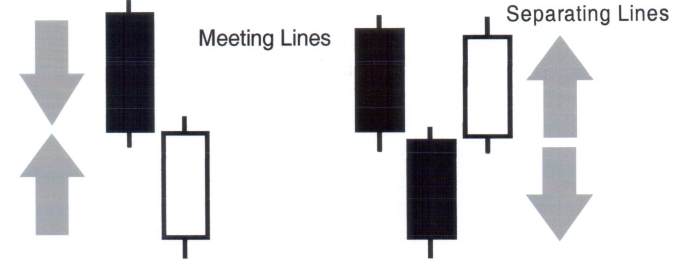
A Separating Line tends to be more explosive at the beginning but tends to correct fairly quickly. Meeting
Lines tend to be weaker and the degree of penetration into the previous period move is important
9a Tasuki
The open of the real-body
which opens into the
previous days session I
haven't found many
ref erences to this pattem
but it does exist and you
should be aware of the
Tasuki as FX markets tend
to like this pattem.
Shadows are not taken into
consideration as we are
primarily concemed by the
suggested Harami - but
closes lower than the
previous session open.
This pattem is closely
related to the Tasuki Gap.
which is a three-line
reversal pattem.
9b Tasuki Gap
The Tasuki gap is a fonvn of star,
but instead of a spinning top or
Doji the gap is preceded by a
standard candle. The ambush line
is the third confirmation line. which
closes the window and forces the
change in the trend and
sentiment.
Reversal Patterns
Top Reversal
|
Bottom Reversal
|
Doji***
|
Dojo***
|
Shooting Star**
|
Hammer***
|
Hanging Man*
|
Star**
|
| Star** |
|
Bearish Engulfing Pattern***
|
Bullish Engulfing pattern***
|
Tasuki - Gap**
|
Tasuki - Gap**
|
Dark Cloud Cover**
|
Piercing line**
|
Harami Lined*
|
Harami line*
|
NB - The stars indicate the strength of the pattem
Three Day Reversals Patterns
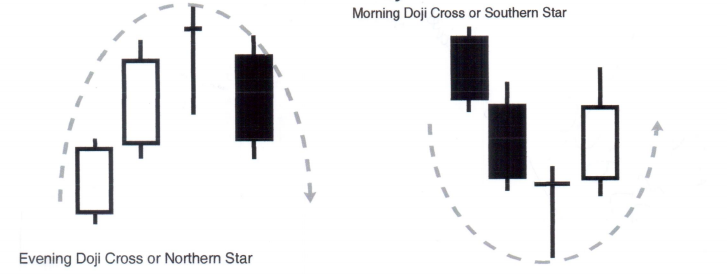
10a. The Evening Star
"Sankawa yoi no myojyo"
The market has to be trending
The second session is a smallstar that has gapped away from the place action.
The third session is always the opposite colour of session 1.
The related pattem (2d/c) would result in a bearish engulfing line/dark cloud cover so is extremely
negative
10b The Morning Star
"Sankawa ake no myojyo"
The market has to be trending
The second session is a small star that has gapped away from the price action.
The third session is always the opposite colour of session 1
The related pattem (2d/c) would result in a bullish engulfing line/piercing pattem, so is extremely
bullish.
10c The Doji Star
10d Sute Go Rain Drop
Sometimes known as the
abandoned baby and is
only distinguished by the
gap between the Doji star
and the last session close.
This pattem does not
require confirmation and
is very powerful.

Sute Go Rain Drop Example

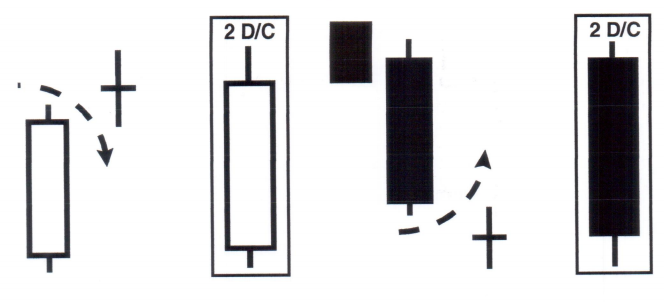
11 Upside Gap 2 Crows
This pattern is extremely rare
Session I is in a downtrend with a lower closing.
Session 2 is a Harami line of sorts but has the
lower close so the colour of the real-bodies are
the same in sessions I and 2.
Session 2 has a long lower shadow and in itself
is a hammer or Taku ri.
Session 3 is a meeting line sentiment is
beginning to change.
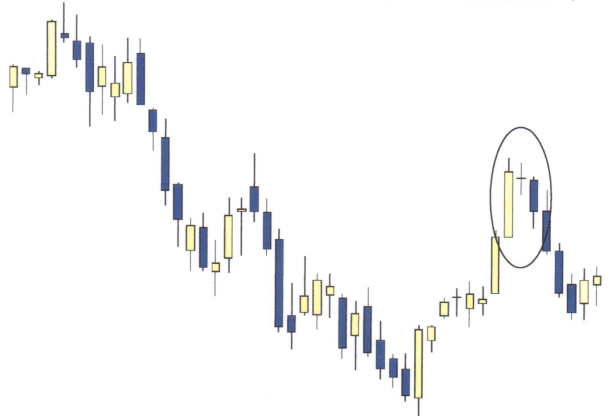
13 Three White Soldiers
13. Three White Soldiers
This pattem shows a bullish reversal.
Session 1, 2 and 3 are allbullish standard lines.
Session 1, 2 and 3 are allbullish standard lines.
The sessions allopen roughly in the middle of
the previous real-body and close higher as
bearish sentiment falters
No confirmation is required.
14. Advance Block
This pattern is potentially a bearish reversaland
certainly defines weakness in the current trend.
The three white candles in a sustained up trend
allopen within the previous session real-body.
The advance block is highlighted by the long
upper shadows leaning towards a shooting star.
Confirmation is required.
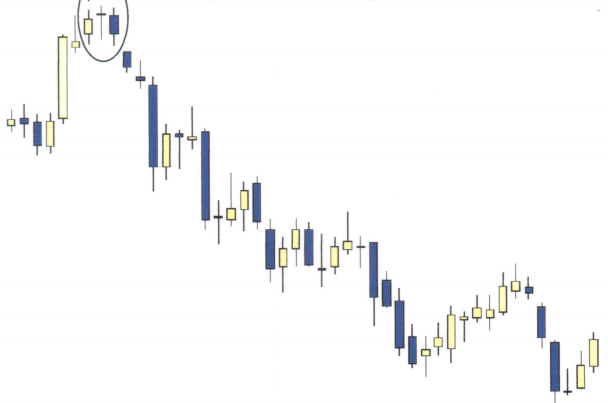
15 Three Black Crows
This pattern shows a bearish revenalpattern.
Three consecutive down candles are formed.
Each line opens within the previous days real body and closes on or near its lows, but lower
than previous session.
No confimlation is required.
16 The Harami age and Harami sage
17 The Tsutsumiage and Tsutsumi sage
18 The Tweezers Top & Bottom -Kenuki
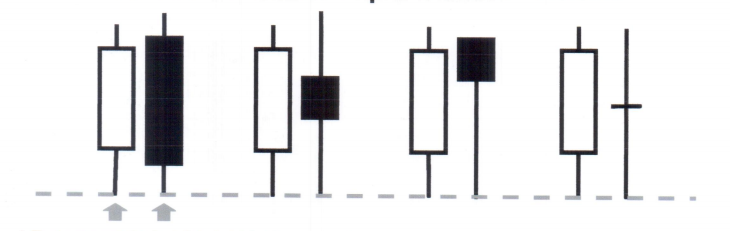
A Tweezers can be found at a market top or a bottom, and occur where the shadows of two consecutive
periods hit the same levelof support or resistance and failto close beyond that level.
A tweezers is best used as a confirmation to a reversal pattern i.e.. An engulfing pattem.
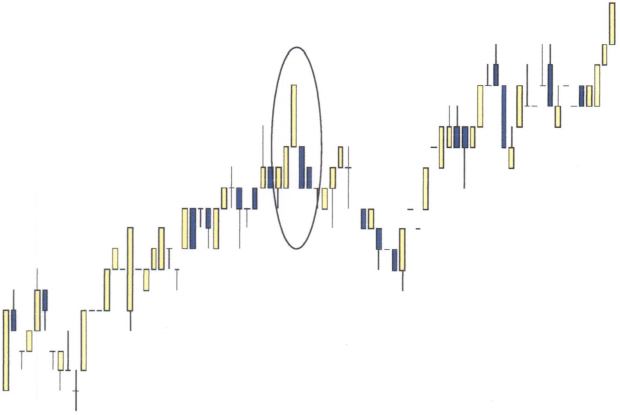
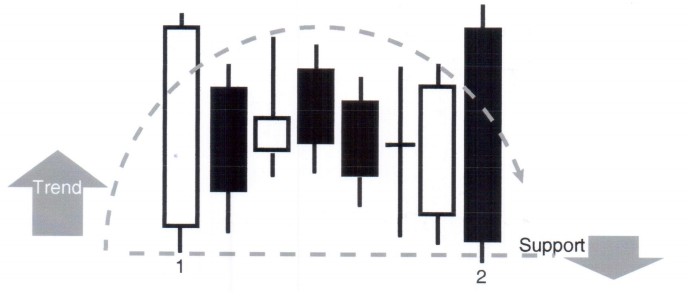
19 High Wave Warning - Takane nochiai
This usually occurs after a strong rally; the high wave is made up of a series of spinning tops, dojis and
umbrellas.
There are lots of clues to the direction of the breakout, but seek a confirmation line
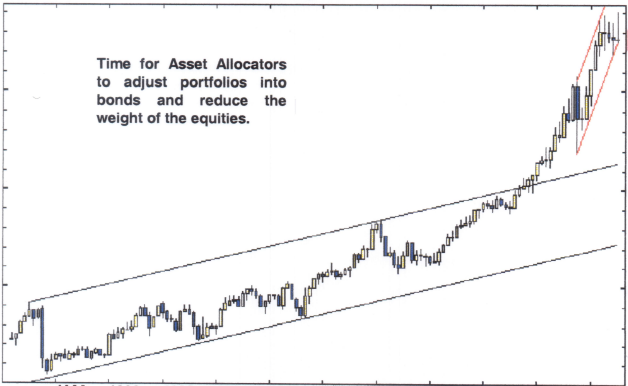
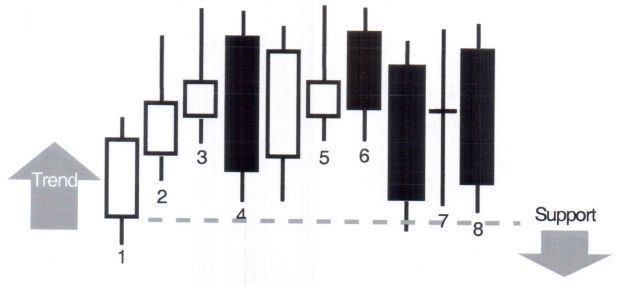
20 Tower Tops and Bottoms - Ohtenjyou
This pattem would equate to a double top and the break below the support following the second tower
and bearish engulfing pattem gives ample warning of the trend reversal.
Chapter 4: Candlestick Analysis
"The Sakata Constitution"
Sokyu Honma 1716 - 1803
The Number Three
Seiki Shimizu wrote in his book, 'the Japanese Chart of Charts', that the number three was very
important to the Japanese people, it was said to hold a divine power. The number four was considered to
be bad luck.
In Westem culture to a certain extent we have a similar belief, the Japanese expression Sandome no
Shojiki is unlike own saying of three times lucky
In modem day TechnicaIAnalysis there are many examples of our use of the number three
Three Trends, Three Gaps, Dow Theory has three phases of trends, Reversal Patterns such as Triple
Tops/Bottoms and Head and Shoulders patterns, three types of triangle, three types of continuation
pattem etc...
Sakatas Five Methods
Sanku
|
- |
Three Gaps
|
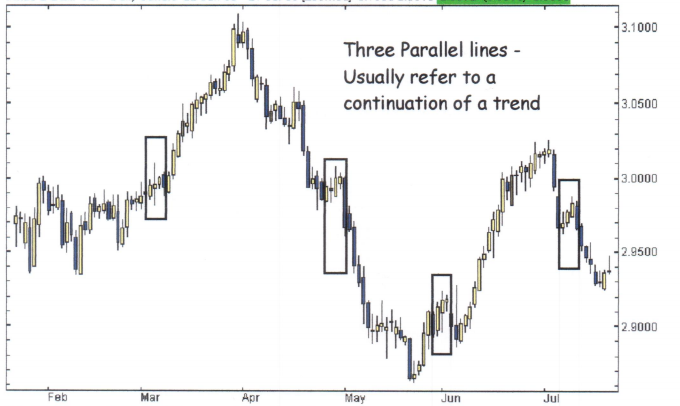
Sanpei
|
- |
Three Parallel Lines
|
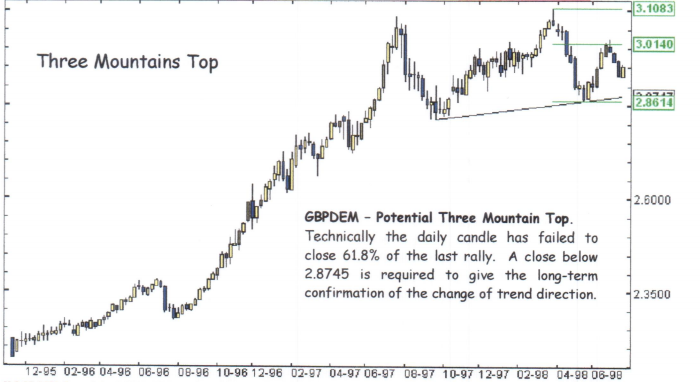
Sanzan
|
- |
Three Mountains
|
Sansen
|
- |
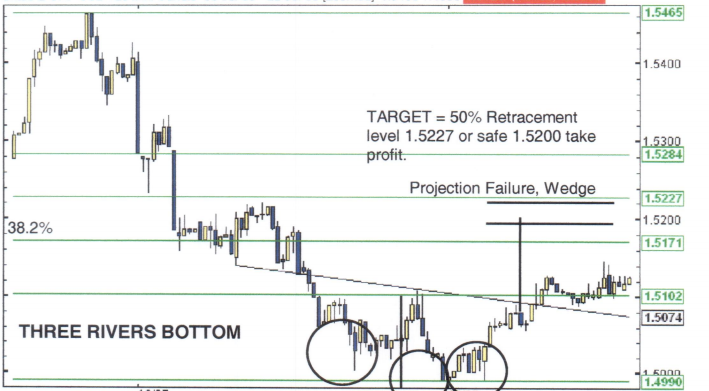
Three Rivers
|
Sanpo
|
- |
Three methods
|
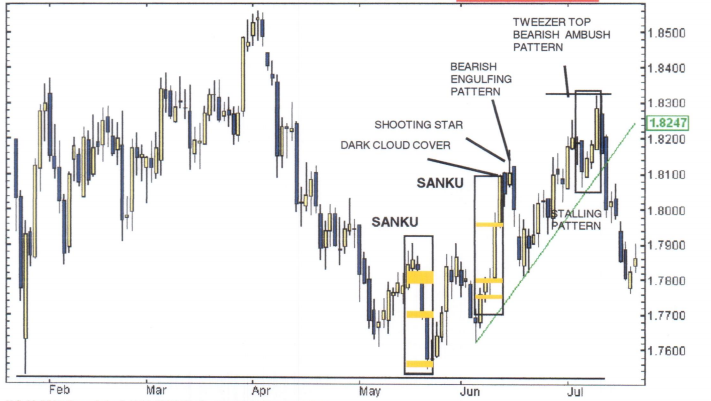
Sanku
Three gaps, this can be a common occurrence in the Commodities and Future markets.
The three common forms of gapping play are the Breakaway gap, Runaway gap and the exhaustion gap.
Sanku is more precise as it refers to a series of gaps between three consecutive candle lines.
Sanku can be made up of three white soldiers or three crows, but always imply weakness present in the
prevailing trends.
Sanku
Sanpei
Sansen
Sanzen
Sanpo - Money Management
Three methods
- When to buy o. Sell
- When to take profit
- When to cut a position
Set Your Rules
Oscillators - I have always looked at two oscillators - The Slow Stochastic and the Relative Strength Index.
lalways use the same parameters for the indicators because Idon't believe in optimisation of an indicator.
Instead. llean towardsstatisticalanalysis looking solely for consistency over time. It is essentialthat you
learn to recognise the strengths and weaknesses of the indicators that you are using
The Parameters that fuse are Slow Stochastic 10-6-3, and RSlof IO
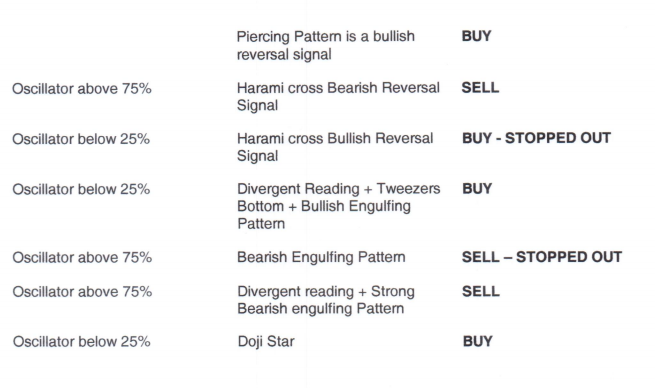
What do look for?
- A reversal pattem in an extreme zone.
- Indicator and Price divergence for the longer term trend reversal.
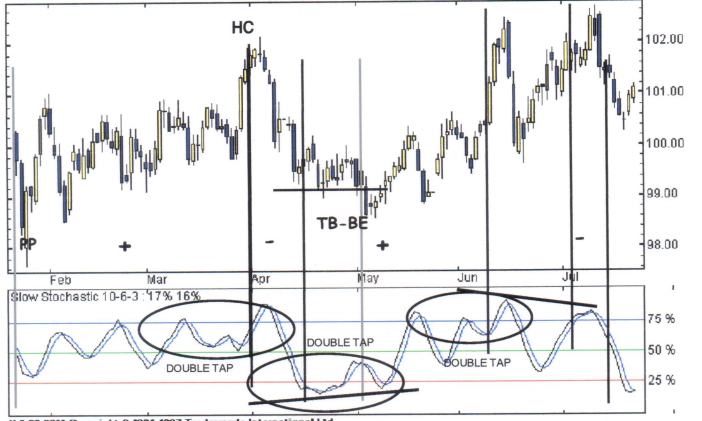
- The Double Tap.
What is a Double Tap?
A Double tap is a failure swing - but observations and experience have shown that the swing must remain
above the 50% line, and where the second peak is higher. The exception to the second peak rule is where
there is obvious price and indicator divergence.

Candlesticks and Oscillators
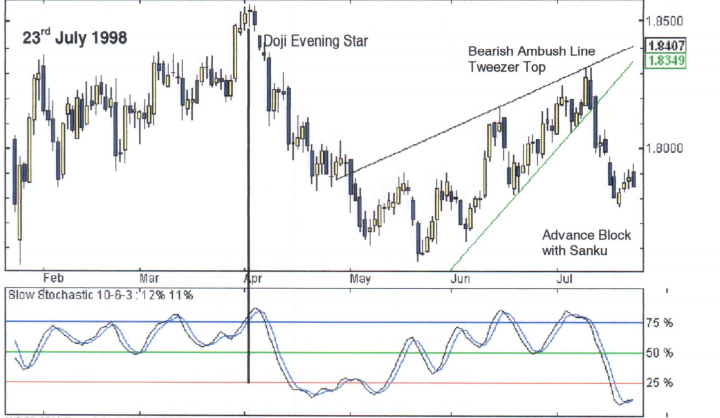
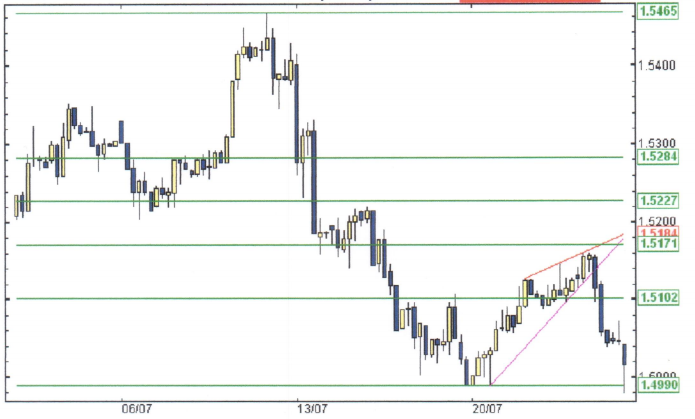
Trading Example
In the last example we can observe the Slow Stochastic oscillator crossing in the oversold zone (below
25%). A lot of people would now consider that from this level we should get a reaction
The Candlesticks, however, show a thrusting pattern - which falls short of the definition of a Piecing line
revensal because of insufficient penetration into the previous session's real-body. (Irrikubi or in
neckline)
The following three sessions are a stalling pattem (Sake zumari) with the three gaps (Sanpo). This
indicates a possible bearish reversal contrary to the impression left by the Slow Stochastic, which has
crossed in oversold zone. The only time I am a buyer is when a proper reversal signal is observed or when
there is clear price Divergence or a Double Tap.
