

Rendering a candlestick chart on a web interface is straightforward enough. The core challenge lies in data architecture: how your application securely ingests, processes, and streams market pricing.
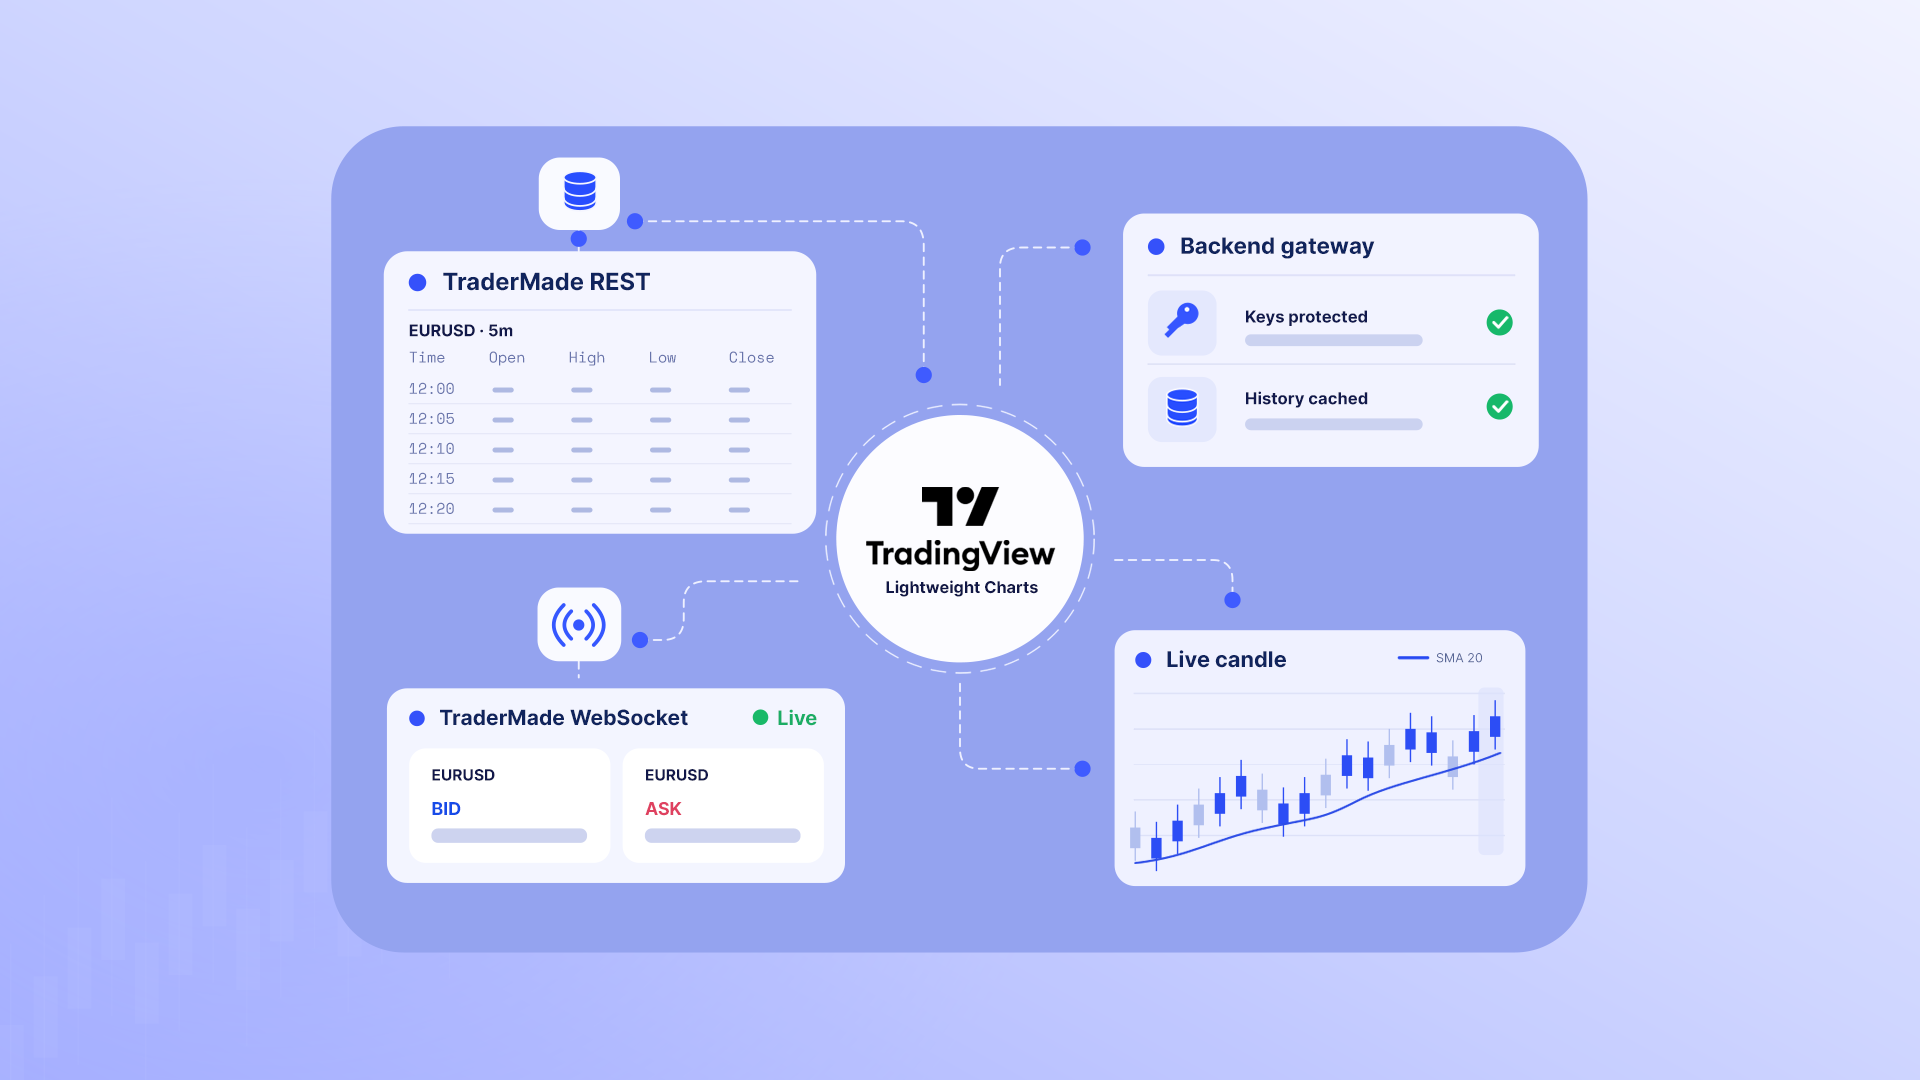
TradingView Lightweight Charts provides a clean, performant visualization layer, but it operates strictly as a front-end library—it carries no native market data feed. Historical candles, real-time quotes, and tick updates must be supplied by a dedicated data pipeline.
Here is how the data components integrate into the stack:
- REST API delivers historical OHLC datasets for charting and backtesting.
- WebSocket API provides low-latency real-time bid and ask streams.
- C++ Backend Service acts as an intermediary layer between TraderMade and the client application, maintaining secure server-side API key management and handling persistent socket connection logic.
- Client-Side Export Engine compiles active in-memory price history into downloadable CSV files for off-platform modeling and record-keeping.
Lightweight Charts consumes this processed stream to render responsive, real-time market visuals. The resulting architecture delivers a robust dashboard suitable for institutional display, while preserving raw market data for downstream analytics, compliance reporting, and programmatic export.
What We Are Building
The dashboard includes:
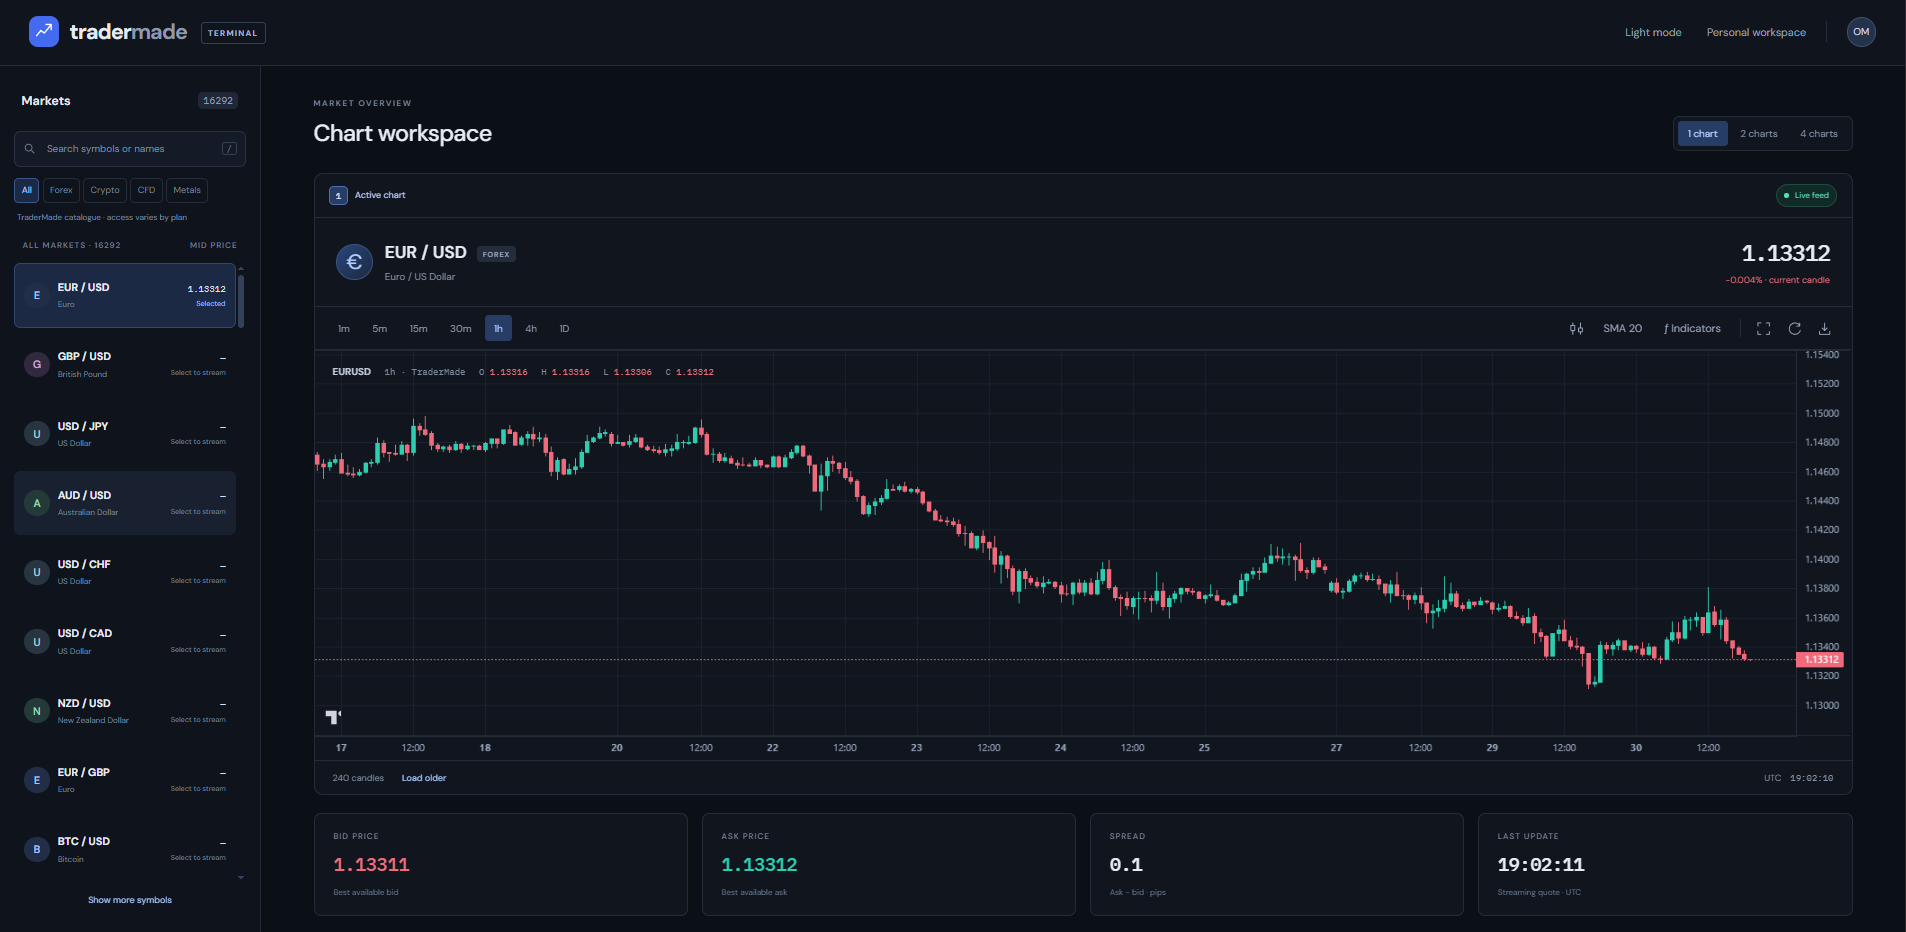
- Multi-Chart Layouts: Toggle between
1-,2-, and4-chart grid views, each with independent symbol, timeframe, and indicator controls - Comprehensive Indicators: Price-based overlays (SMA, EMA, Bollinger Bands, Supertrend) and oscillator panels (RSI, MACD, ATR, Stochastic)—all computed without requiring volume data
- Seven Timeframes: Seamless switching from
1mto1D - Real-Time Market Data: Stream live bid, ask, and spread quotes alongside dynamic bar updates for the current active candle
- Chart Views & Customization: Switch between candlestick and line charts, with a persistent Light/Dark theme setting
- Live Price Alerts: Set one-shot "above" or "below" live market price triggers
- Saved Watchlists: Pin favorite currency pairs and instruments for quick access
- Data Export & Pagination: Infinite historical scrolling with lazy loading and instant CSV export
The project also supports TraderMade's instrument catalogue across Forex, Crypto, Metals and CFDs, subject to the access available on your account.
There are two market-data paths:
Historical data

TraderMade REST API
        ↓
    C++ Backend
        ↓
      Browser
        ↓
 Lightweight Charts
Real-time data

TraderMade WebSocket
        ↓
    C++ Backend
        ↓
      Browser
        ↓
Current candle + quotes
REST gives us the historical context. WebSockets keep the latest price moving.
Project Architecture & Setup
You can clone or download the complete workspace from the TraderMade Forex Dashboard Repository. Detailed environment setup, dependency management, and build instructions for local execution are available directly in the repository README.
Once cloned, the project structure separates the high-performance backend data management from the frontend chart canvas:
project/
│
├── backend/
│   └── C++ Backend Gateway
│       - TraderMade REST requests & history orchestration
│       - Upstream WebSocket connection & session recovery
│       - Server-side API key isolation
│       - Multi-tier historical caching (Memory & Parquet)
│
├── frontend/
│   └── src/main.ts
│       - Lightweight Charts setup & rendering
│       - Stream buffering & real-time tick integration
│       - Historical pagination & view offset management
│       - Workspace CSV export
│
└── shared/
    └── market.ts
        - Timeframe bucket definitions
        - Midpoint price calculations
        - Real-time tick-to-candle aggregation rules
Step 1: Load Historical Data from TraderMade
Before streaming live quotes, any chart needs historical context so traders can see where the market was trading earlier in the session.
When a user opens any symbol, let's say EURUSD on a 5m chart, the browser sends a request to our C++ backend:
GET /api/history?symbol=EURUSD&timeframe=5m
This is how our backend maps our chart timeframe to Timeseries API parameters.
| Dashboard | TraderMade interval | Period |
|---|---|---|
1m |
minute |
1 |
5m |
minute |
5 |
15m |
minute |
15 |
30m |
minute |
30 |
1h |
hourly |
1 |
4h |
hourly |
4 |
1D |
daily |
1 |
So:
EURUSD + 5m
becomes:
currency = EURUSD
interval = minute
period   = 5
backend/src/history.cpp makes the upstream request using the server-held REST key.
The backend appends the server-held REST key and queries TraderMade. Before sending the payload back to the browser, candles are normalized into:
{
    time,
    open,
    high,
    low,
    close
}
This keeps provider-specific logic securely on the backend while shielding the browser from heavy data processing. Offloading data normalisation, duplicate removal, and timestamp sorting to the server prevents the frontend from freezing or degrading canvas rendering performance when handling large historical time-series datasets.
Step 2: Display the Candles
Now that our backend is handling the historical REST data and keeping credentials secure, we can render the candles on the UI using TradingView's Lightweight Charts library:
npm install lightweight-charts
In frontend/src/main.ts, we initialize the chart canvas container and configure our candlestick series with custom color styling:
import {
    createChart,
    CandlestickSeries,
    ColorType,
    type UTCTimestamp,
} from 'lightweight-charts';

// Mount the chart canvas to the DOM element and set theme options
const chart = createChart(
    document.querySelector<HTMLElement>('#chart')!,
    {
        autoSize: true,
        layout: {
            background: {
                type: ColorType.Solid,
                color: '#10151e',
            },
            textColor: '#7c879c',
            attributionLogo: true,
        },
    }
);
Here, createChart sets up the dark layout background, handles responsive sizing, and attaches the canvas to our #chart container element.
// Add the candlestick series and define bullish/bearish candle colors
const candleSeries = chart.addSeries(CandlestickSeries, {
    upColor: '#2dceb0',   // Green for bullish candles
    downColor: '#ef6b7b', // Red for bearish candles
    borderVisible: false,
});
Calling chart.addSeries(CandlestickSeries) creates a new candlestick layer on the canvas, configured with custom colors for bullish (upColor) and bearish (downColor) bars. We store this instance in candleSeries so we can pass data to it later.
When the timeseries payload arrives from our backend, we populate the chart by calling .setData():
candleSeries.setData(
    candles.map(candle => ({
        ...candle,
        time: candle.time as UTCTimestamp,
    }))
);
Passing the array to .setData() replaces any existing bars on the canvas and renders the entire historical dataset in a single operation. We cast candle.time to UTCTimestamp to satisfy Lightweight Charts' TypeScript definitions and prevent type errors with Unix timestamps.
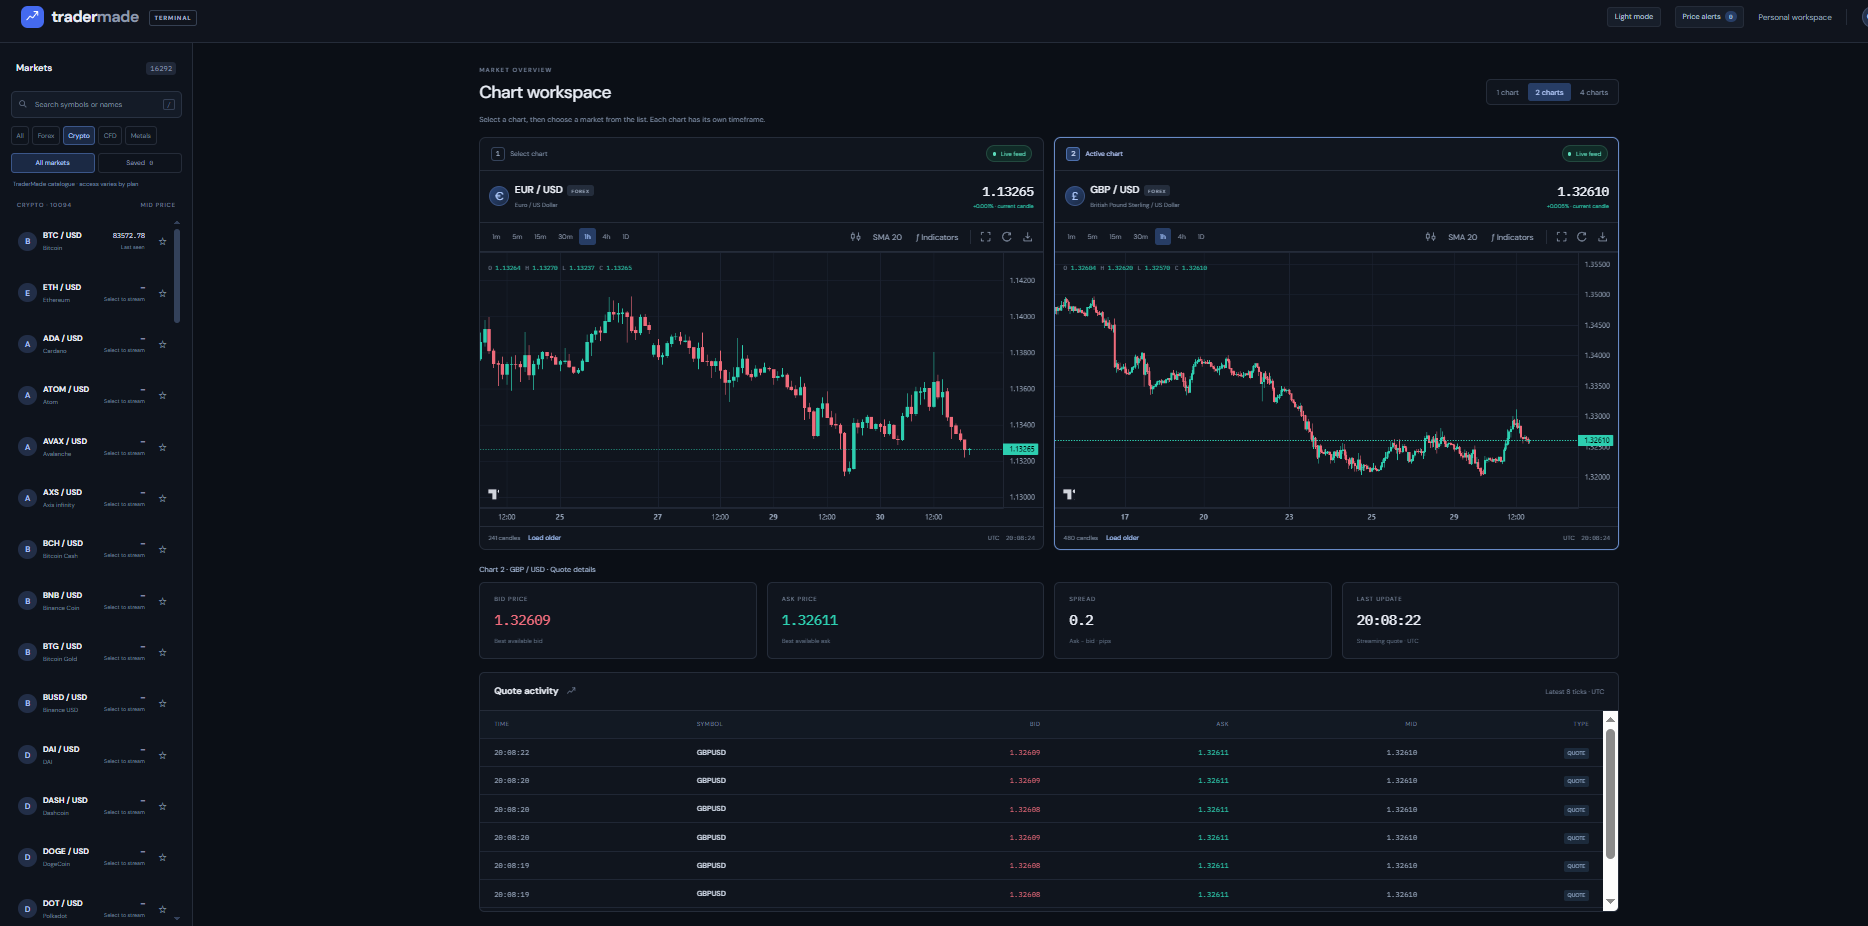
The same rendering setup extends to multi-chart layouts (1-, 2-, and 4- grid views), where each active panel maintains its own isolated series instance, timeframe, and selected symbol.
Step 3: Add the Live TraderMade Feed
Now that we know how to fetch and plot historical candles, we need a way to keep the chart moving in real time without lagging or constantly polling a REST API. For live price updates, we switch to WebSocket feed to capture price action the millisecond it hits the market.
Our C++ backend (backend/src/network.cpp) manages this upstream connection to:
wss://stream.tradermade.com/feedAdv
Upon opening the socket, the backend authenticates using the WS_API_KEY:
{
    "action": "login",
    "key": "WS_API_KEY",
    "fmt": "JSON"
}
Once authenticated, it subscribes to the symbols currently requested by connected browser tabs:
{
    "action": "subscribe",
    "symbols": ["EURUSD:QUOTE"]
}
// backend/src/network.cpp - Upstream TraderMade WebSocket Session
#include <boost/asio.hpp>
#include <boost/beast.hpp>
#include <nlohmann/json.hpp>
#include <iostream>

namespace beast = boost::beast;
namespace websocket = beast::websocket;
using json = nlohmann::json;

class TraderMadeWSClient {
    websocket::stream<beast::tcp_stream> ws_;
    std::string api_key_;

public:
    TraderMadeWSClient(boost::asio::io_context& ioc, std::string api_key)
        : ws_(ioc), api_key_(std::move(api_key)) {}

    void connect_and_subscribe(const std::vector<std::string>& symbols) {
        // Authenticate session
        json auth_payload = {
            {"action", "login"},
            {"key", api_key_},
            {"fmt", "JSON"}
        };
        ws_.write(boost::asio::buffer(auth_payload.dump()));

        // Subscribe to requested instrument quotes
        json sub_payload = {
            {"action", "subscribe"},
            {"symbols", symbols}
        };
        ws_.write(boost::asio::buffer(sub_payload.dump()));
    }
};
Step 4: Turn Quotes into Candles
The tick-to-candle aggregation logic in frontend/src/market.ts assigns each incoming quote to its timeframe bucket:
const seconds = timeframes[timeframe].seconds;
const time = Math.floor(quote.time / seconds) * seconds;
On a 5-minute chart (300 seconds), any quote arriving between 10:00:00 and 10:04:59 maps to the 10:00:00 candle timestamp.
If the quote belongs to the active bar, we adjust its high, low, and close values:
return {
    ...last,
    high: Math.max(last.high, quote.mid),
    low: Math.min(last.low, quote.mid),
    close: quote.mid,
};
When a tick crosses into a new timeframe boundary, we initialize a fresh candle:
return {
    time,
    open: quote.mid,
    high: quote.mid,
    low: quote.mid,
    close: quote.mid,
};
Finally, we update the canvas:
candleSeries.update({
    ...candle,
    time: candle.time as UTCTimestamp,
});
Using .update() mutates only the active bar on the canvas, delivering smooth chart updates without re-rendering the historical series.
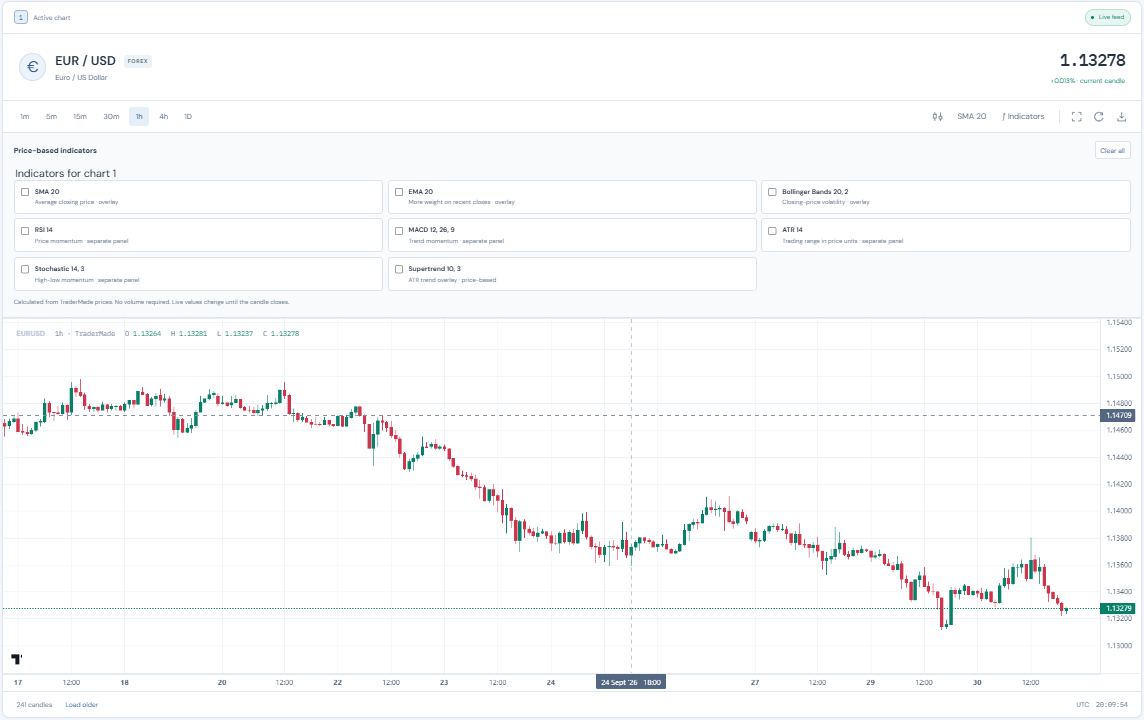
As live ticks update the active candle, price-based indicators like SMA, EMA, Bollinger Bands, Supertrend, RSI, MACD, ATR, and Stochastic re-calculate in real time.
Step 5: Syncing History and Streaming Data
When combining historical REST queries with a live WebSocket feed, race conditions can occur if a live tick arrives while historical data is still fetching. Painting that tick immediately would cause .setData() to reset the canvas moments later, overwriting the new price.
To prevent data loss without interrupting TraderMade's real-time WebSocket connection, incoming ticks are briefly queued in a memory buffer while historical candles load. Once .setData() populates the chart base, the buffered ticks flush instantly to the canvas:
Request History ──► Receive Live Ticks ──► Hold in Memory
                                                │
                                         History Loads (.setData)
                                                │
                                                ▼
                                     Flush Buffer to Canvas ──► Direct UI Updates
Capping the queue at 5,000 pending ticks protects memory during high-latency requests, ensuring zero tick loss or visual glitches when switching symbols or timeframes.
// frontend/src/main.ts - Tick Buffer & Flush Synchronization
let tickBuffer: Quote[] = [];
let isHistoryLoaded = false;
const MAX_BUFFER_SIZE = 5000;

function handleIncomingTick(quote: Quote) {
    if (!isHistoryLoaded) {
        if (tickBuffer.length < MAX_BUFFER_SIZE) {
            tickBuffer.push(quote);
        }
        return;
    }
    processTickToChart(quote);
}

async function loadHistoryAndConnect(symbol: string, timeframe: string) {
    isHistoryLoaded = false;
    tickBuffer = [];

    const history = await fetchHistory(symbol, timeframe);
    candleSeries.setData(history);
    isHistoryLoaded = true;

    // Flush pending buffered ticks to sync active candle
    while (tickBuffer.length > 0) {
        const bufferedQuote = tickBuffer.shift()!;
        processTickToChart(bufferedQuote);
    }
}
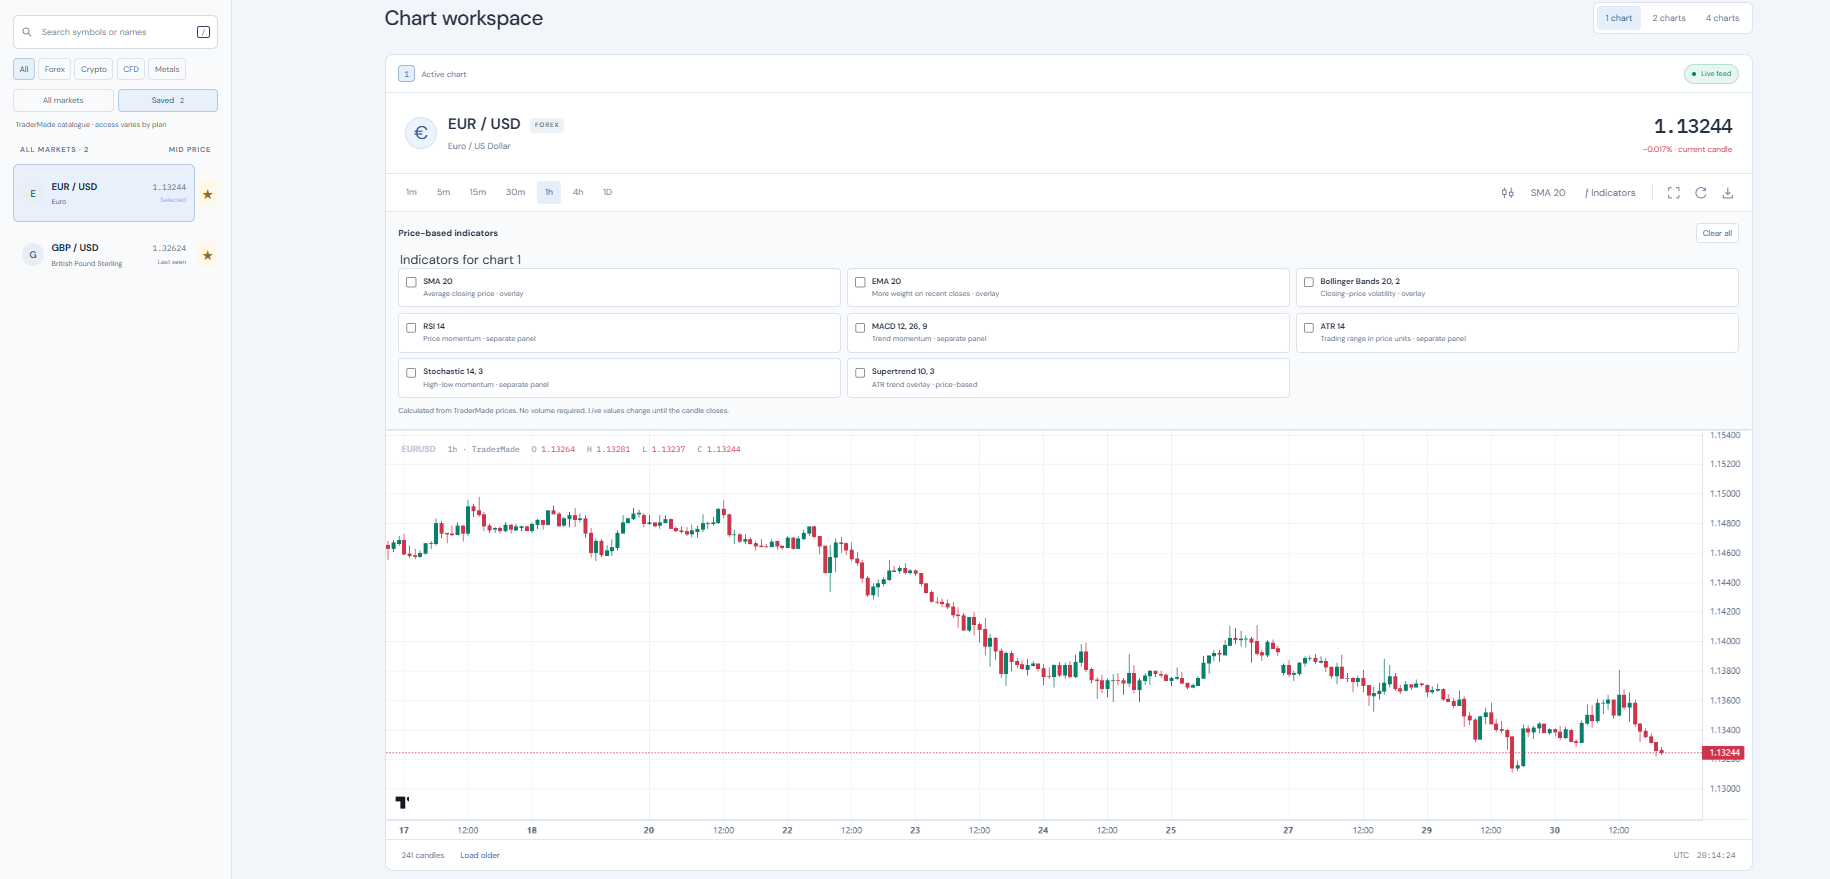
As streaming quotes arrive, the client simultaneously updates the active candle, evaluates active one-shot price alerts (above/below triggers), and updates live prices across saved watchlist markets.
Step 6: Load and Cache Older History
To keep the initial load fast, the dashboard only fetches the recent historical window required to fill the screen. As users scroll back through time, the frontend lazily requests older candle blocks on demand:
GET /api/history?symbol=EURUSD&timeframe=1h&before=1700000000
When new history arrives, the frontend prepends the older candles to the existing series while preserving the current scroll position. This avoids jarring visual jumps or re-renders while the user inspects past price action.
Multi-Tier Backend Caching
To minimise API usage and keep response times low, the C++ backend implements a multi-tier cache. Before making an upstream request to TraderMade, it evaluates requests through three layers:
In-Memory Cache (RAM)
        │
        ▼ (miss)
Parquet Filesystem Storage
        │
        ▼ (miss)
TraderMade REST API
Completed historical ranges—where candle values are immutable—are cached indefinitely in memory or stored as Parquet files on disk. Forming or recent candles are cached with short TTLs (Time-To-Live) so they refresh frequently.
We have covered this caching pattern in more detail in our tutorial How to Build a Timeseries Caching System for a Trading Platform, where we also explore the speed differences, latency reduction, and scaling benefits of caching. That tutorial uses Redis as the in-memory layer and Parquet for persistent storage, whereas this dashboard keeps its first cache layer inside the C++ process. The principle is the same: serve repeated historical requests locally where possible, and only go back to the upstream API when the data is not already available.
Step 7: Exporting Data to CSV
Because the dashboard maintains loaded candles in memory, exporting time-series data to CSV requires no extra API round-trips.
We handle the client-side download directly in frontend/src/main.ts:
document.querySelector<HTMLButtonElement>('#export')?.addEventListener('click', () => {
    const csvHeader = 'time,open,high,low,close\n';
    const csvRows = candles.map(c =>
        `${new Date(c.time * 1000).toISOString()},${c.open},${c.high},${c.low},${c.close}`
    ).join('\n');

    const blob = new Blob([csvHeader + csvRows], { type: 'text/csv;charset=utf-8;' });
    const url = URL.createObjectURL(blob);

    const link = document.createElement('a');
    link.href = url;
    link.download = `${selectedSymbol}-${selectedTimeframe}.csv`;
    link.click();

    setTimeout(() => URL.revokeObjectURL(url), 1000);
});
This generates a file containing every candle currently populated in the client memory—including older blocks lazily loaded during scrolling.
Using the Same Data Beyond the Chart
The chart is only one consumer of the data flowing through this pipeline. By decoupling data retrieval from UI rendering, the same stream can power various parts of a trading or research workflow without creating duplicate API connections.
                TraderMade API & Stream
                           │
                           ▼
                      C++ Backend
                           │
                    Market Data Bus
    ┌───────────────┬──────┴────────┬───────────────┐
    ▼               ▼               ▼               ▼
 Trading       CSV Export         Quant         Internal
  Chart                         Research        Services
Keeping the market-data layer independent brings several key benefits:
- Quantitative Research: Data science and research teams can export historical candles straight into Python, Jupyter Notebooks, or custom analysis pipelines to model volatility, test strategies, or investigate market anomalies.
- Backtesting Engines: Strategy backtesters can consume the exact same historical datasets directly from the local cache or C++ proxy, running backtests without relying on a DOM chart canvas.
- Real-Time Platform Services: Live market feeds can be multiplexed to drive watchlists, price alert triggers, risk engines, and order-execution services simultaneously.
- Multi-Product Engineering: Fintech teams building algorithmic workflows or multi-asset tools can plug into both historical context and live quotes without instantiating a visual chart component for every background worker.
Ultimately, treating the chart as just one of many downstream consumers keeps your architecture lean, reduces unnecessary API traffic, and allows your trading infrastructure to scale cleanly as product requirements grow.
Conclusion and Key Takeaways
Building a market data trading dashboard requires a strict separation of concerns across the architecture. Lightweight Charts provides high-performance client-side visualization, while the C++ backend serves as a resilient data access layer—handling gateway authentication, multiplexing streaming connections, and enforcing multi-tier caching strategies.
Complete Source Code
You can access, clone, and deploy the full repository—including the C++ backend service and TypeScript frontend—on GitHub:
View Project Repository on GitHub
```